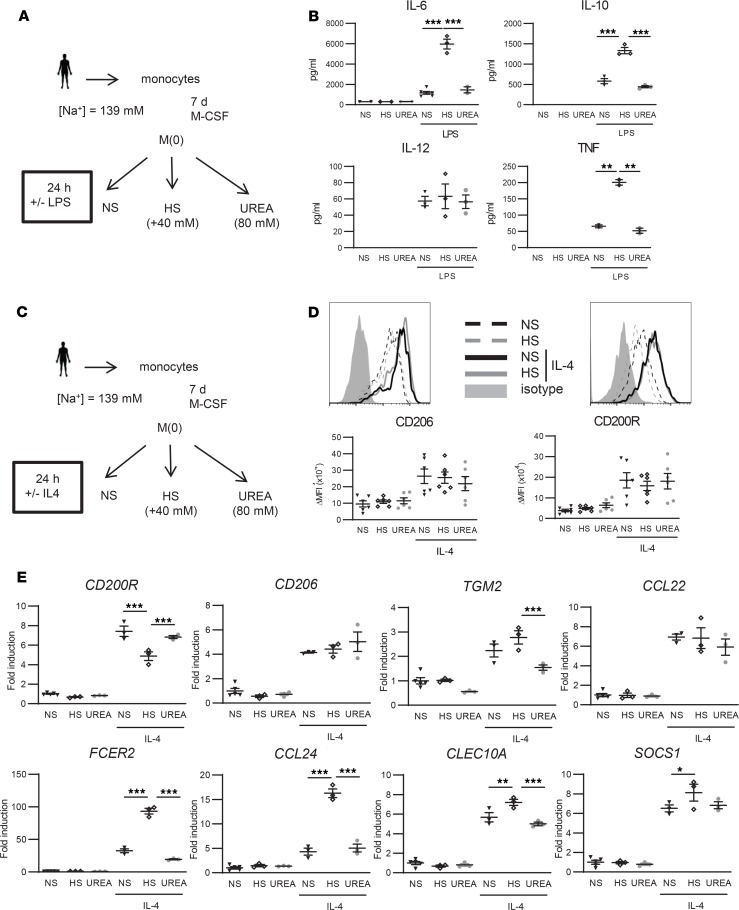
Figure 6. High salt (HS) boosts LPS-induced cytokine secretion in macrophages in vitro but does not affect the activation of M(IL-4).
(A) Schematic overview of in vitro LPS stimulation of macrophages. Monocytes of healthy volunteers were cultured in the presence of M-CSF for 7 days to differentiate into mature macrophages and stimulated for 24 h with LPS in the presence of normal salt (NS) concentrations present in IMDM medium (NS; [Na+] = 139 mM), HS ([Na+] = 179 mM; i.e., IMDM medium supplemented with an additional 40 mM NaCl), or 80 mM urea as tonicity control. (B) IL-6, IL-10, IL-12, and TNF were quantified by ELISA. (C) Schematic overview of in vitro IL-4 stimulation of macrophages. (D) Differentially treated macrophages were stained with antibodies against the M2 surface markers CD206 and CD200R, or isotype control, followed by flow cytometric analysis. Representative histogram graphs and corresponding surface expression quantifications (ΔMFI = [MFI]positive staining – [MFI]isotype staining) are presented. (E) Gene expression of IL-4–induced M2 marker genes. The fold inductions of indicated marker genes are shown relative to the expression in untreated macrophages (= 1). M-CSF, macrophage CSF; NS, ([Na+] = 139 mM); HS, ([Na+] = 179 mM); MFI, median fluorescence intensity. Values represent mean ± SEM of at least n = 3 healthy male donors. n = 3 (1 outlier excluded for TNF for B, n = 6 for D, n = 3 for E). Data tested using 1-way ANOVA. *P < 0.05; **P < 0.01; ***P < 0.001.

