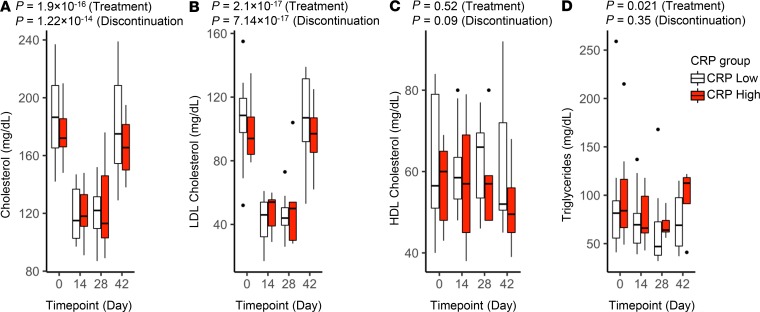
Figure 2. Effect of rosuvastatin on serum lipids.
Serum total cholesterol (A), LDL-C (B), HDL-C (C), and triglycerides (D) were measured in study participants at the indicated trial time points (baseline [day 0], rosuvastatin treatment [days 14 and 28], and 14 days after rosuvastatin discontinuation [day 42]). Data for subjects with low versus high CRP at baseline are plotted separately. Boxes depict IQR around the median. The upper whisker extends from the hinge to the largest value no further than 1.5 * IQR from the hinge; the lower whisker extends from the hinge to the smallest value at most 1.5 * IQR of the hinge. Outlying points are plotted individually. Nominal P values for rosuvastatin treatment and discontinuation were determined for the overall study group by linear regression (also listed in Table 2 and Table 3).

