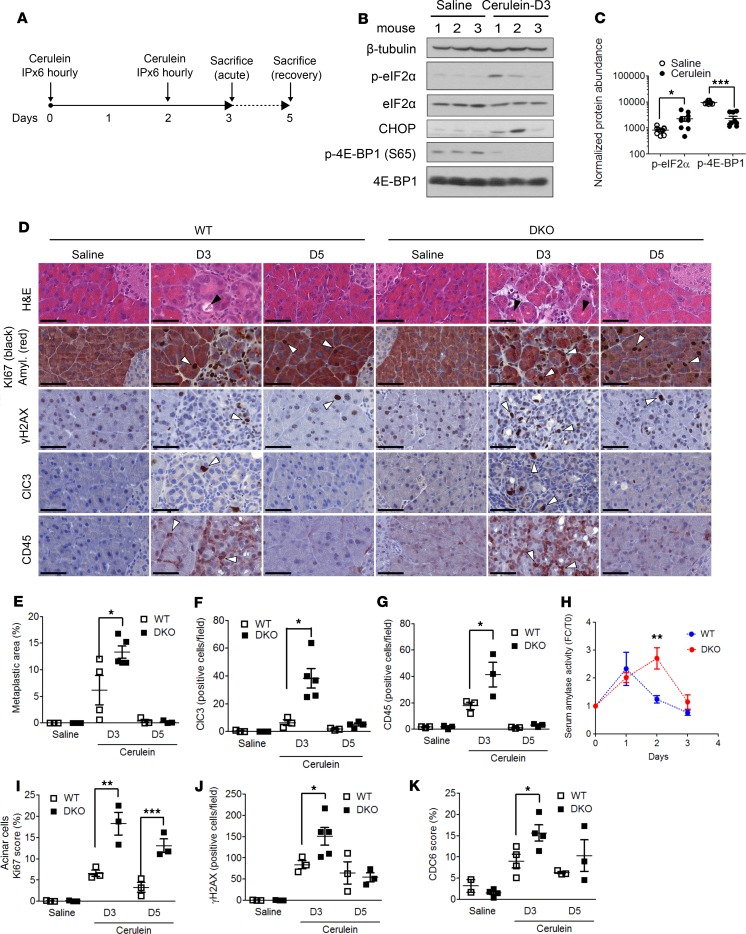
Figure 4. 4E-BP1 loss increases pancreatitis-induced metaplasia but favors recovery through enhanced proliferation and DNA repair.
(A) Cerulein-induced pancreatitis experimental design. (B) Pancreatic extracts obtained from WT mice during acute phase (D3) were subjected to western blot analysis using indicated antibodies (n = 3). (C) Quantification of relative phosphorylated eIF2α and 4E-BP1 protein levels from B. P values were calculated using Student’s t test (*P < 0.05, ***P < 0.001). (D) Representative H&E and IHC stainings of WT and 4E-BP1/2–KO (DKO) mice injected with cerulein during acute phase (D3) or after recovery (D5). Scale bar: 50 μm. IHC using indicated antibody. Black arrows indicate metaplastic lesions and interstitial expansion; white arrows indicate IHC staining. Representative of 2 independent experiments with 3–5 animals per conditions. (E) Quantification of ADM lesions/total pancreas surface. Quantification of (F) Cleaved-caspase 3–positive cells (ClC3) and (G) CD45-positive cells performed on 5 random 10× magnification fields in each mouse. (H) Measure of serum amylase during pancreatitis induction. Quantification of (I) Ki-67 positive acinar cells, (J) γH2AX-positive cells, and (K) CDC6-positive cells performed on 5 random 10× magnification fields in each mouse. Mean ± SEM. P values were calculated using Student’s t test (*P < 0.05; **P < 0.01; ***P < 0.001).

