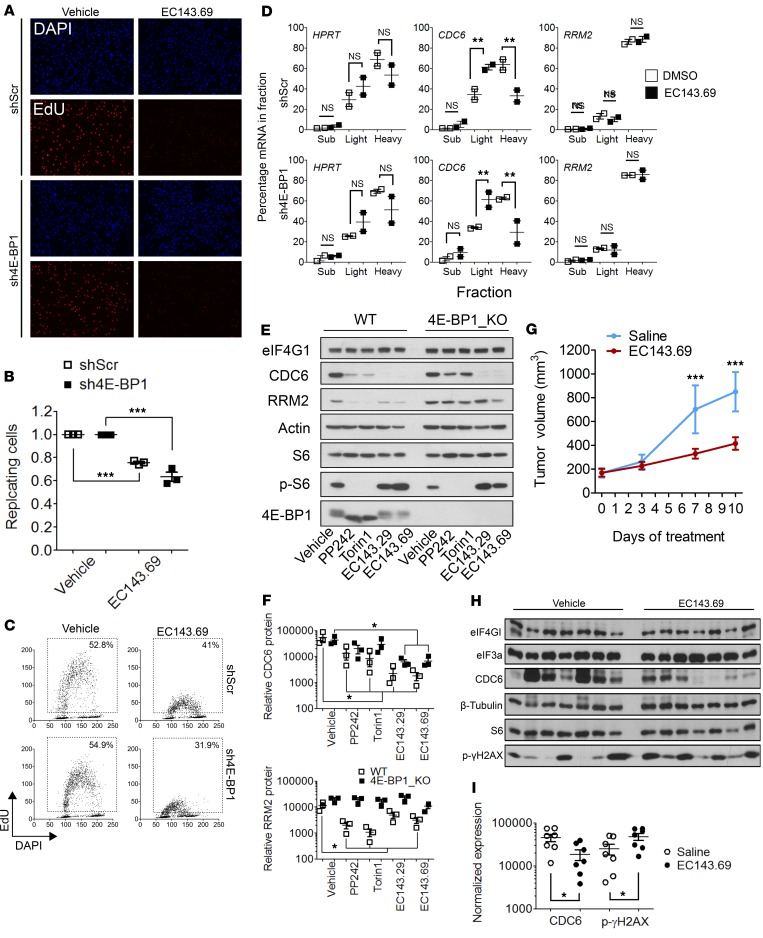
Figure 6. Silvestrol analogs abrogate DNA replication in pancreatic cancer cells and pancreatic tumor growth.
(A) Asynchronous shScramble or sh4E-BP1 MiaPaca-2 cells were incubated with EC143.69 (50 nM) for 3 hours and labeled with EdU. Nuclear DNA was counterstained by DAPI. (B) The proportions of replicating cells are shown as means and SDs and were generated from at least 3 independent experiments. P values were calculated using 2-way ANOVA (***P < 0.001). (C) Quantitative image-based cytometry (QIBC) single-cell analysis of EdU-labeled cells. Total EdU and DAPI values from B are plotted in a scatter diagram. Percentages indicate the proportion of replicating cells. (D) The abundance of HPRT (control), RRM2, and CDC6 mRNAs along polysomes fractions was analyzed by real-time PCR. P values were calculated using Student’s t test (**P < 0.01). Representative of 2 independent experiments. (E) Western blot analysis of indicated proteins in WT or 4E-BP1–KO MiaPaca-2 cells treated with vehicle or PP242 (2.5 μM), Torin1 (500 nM), EC143.29 (50 nM), or EC143.69 (50 nM) for 3 hours. Representative of 3 independent experiments. (F) Quantification of relative CDC6 and RRM2 protein levels from E. P values were calculated using Student’s t test (*P < 0.05). (G) Syngeneic fibrotic pancreatic tumors were grafted s.c. in C57Bl/6J mice. Mice were daily injected with EC143.69 or saline, and tumor growth was monitored at the indicated day. Seven animals per condition. Representative of 2 independent experiments. P values were calculated using 2-way ANOVA (***P < 0.001). (H) Western blot analysis of indicated proteins from tumor extracts in Saline-injected (left) or EC-143.69-injected (right) mice from G. (I) Quantification of relative CDC6 and p-γH2AX protein levels from H. P values were calculated using Student’s t test (*P < 0.05).

