
Figure 1.
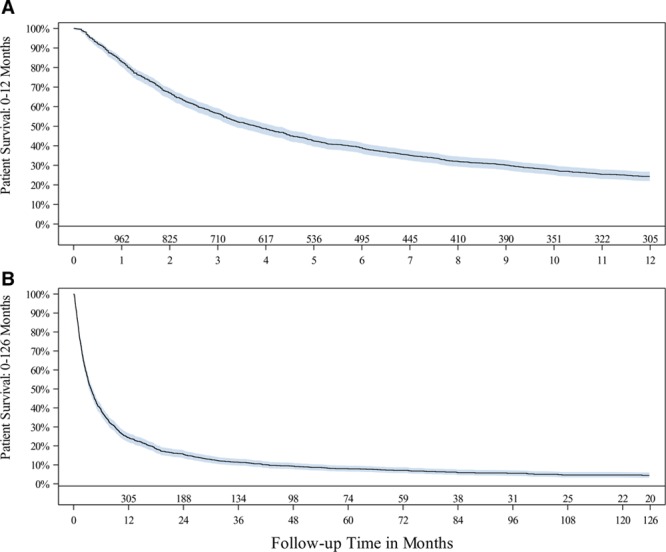
Patient survival from all-cause death through (A) 12 mo and (B) 126 mo. Shaded area represents the 95% confidence interval at that time point. Number of patients at risk are shown at select months of follow-up. Data are shown when there are ≥20 patients in each 3-mo interval.