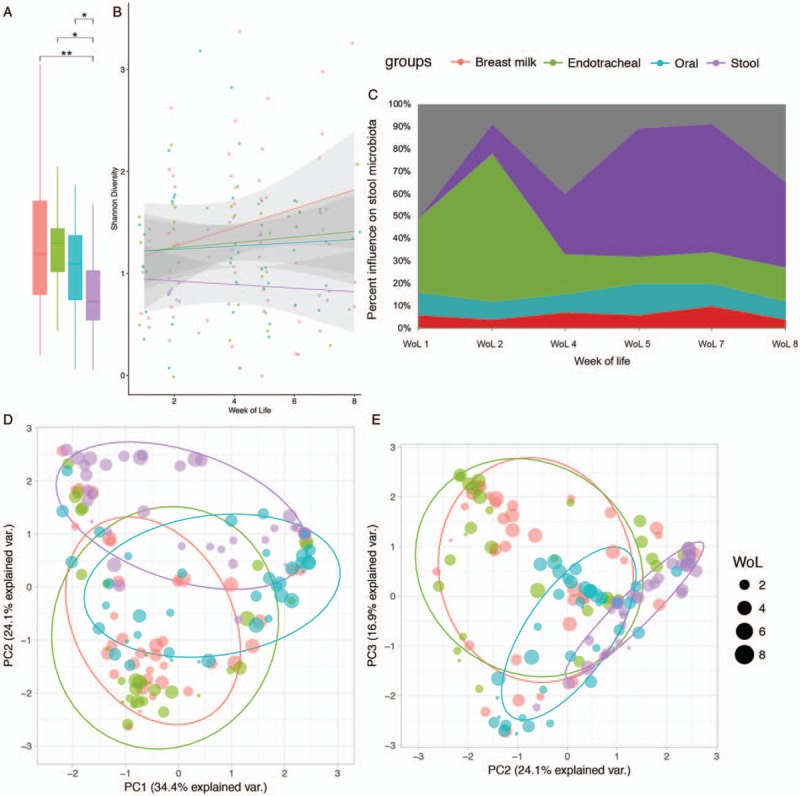
FIGURE 2.

Longitudinal community differences between breast milk (red), oral (blue), endotracheal (green), and stool (purple), microbiota. Stool was significantly less diverse (Shannon diversity), than breast milk (MWW: P.adj = 0.009), endotracheal (MWW: P.adj = 0.014), and oral (MWW: P.adj = 0.024) communities (A), with longitudinally decreasing diversity (B). Potential sources of the stool microbiota, including unknown sources (grey), as calculated by SourceTracker are illustrated longitudinally (C). Beta diversity (Bray-Curtis dissimilarity) between microbiota is illustrated in ordinations (D, E), and explains 74.5% of sample variance. Point size in ordinations depicts week of life. Results of the respective pairwise PERMANOVA are available online (table, SDC13, Supplemental Digital Content). PC = principle component; WoL = week of life.
