
FIGURE 3.
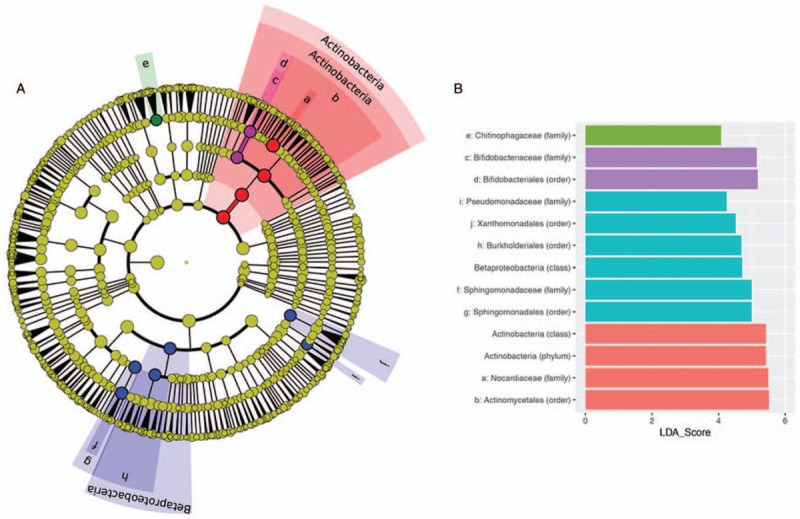
Results of LEfSe analysis, identifying the discriminative rare taxonomic features between the 4 sampling sites investigated (A), and describing the effect size of each discriminative feature (B). The cladogram is rooted at the kingdom level and discriminative features identified following removal of 4 dominant common taxa are coloured by site as described in Figure 2. Where space was not available to plot the taxon name on the cladogram (A) a letter was assigned. These correspond to the taxa, as detailed in (B).