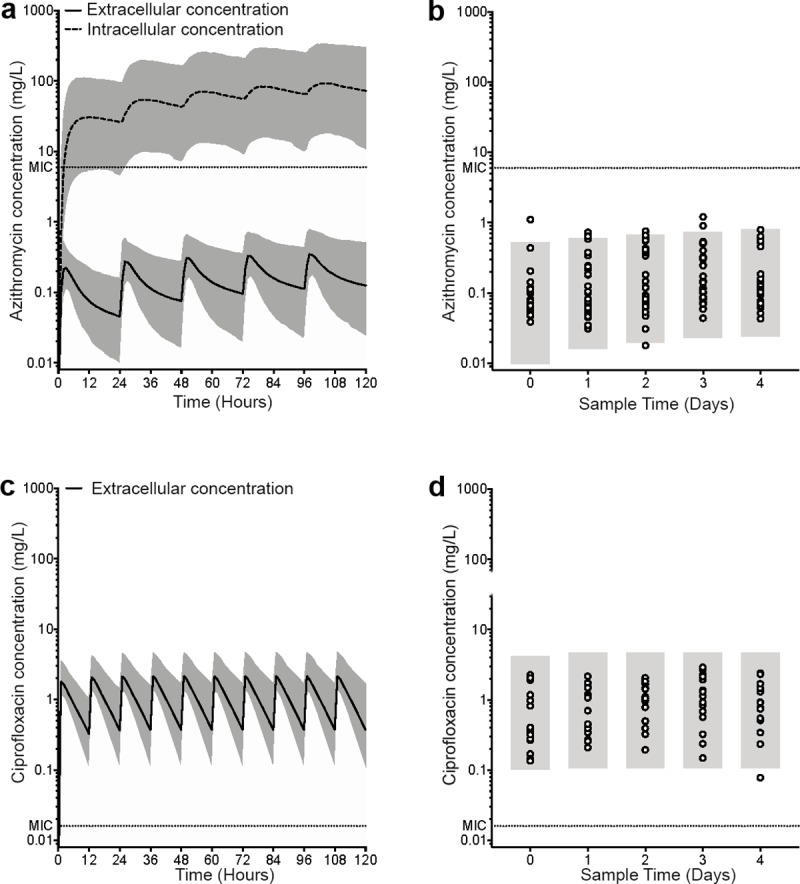
Fig 4. PK simulations and observed plasma concentrations.

(A and C) PK simulations showing (A) azithromycin 500 mg daily and (C) ciprofloxacin 500 mg twice daily. The solid black line represents the median predicted plasma concentration. The dotted black line represents the median predicted intracellular concentration. The grey area represents the 5th-95th percentile. The horizontal dotted line represents the minimum inhibitory concentration (MIC) (B and D) Open circles represent observed plasma concentrations. The grey area represents the minimum 5th and maximum 95th percentile for each day as predicted in A and C. The horizontal dotted line represents the MIC.
