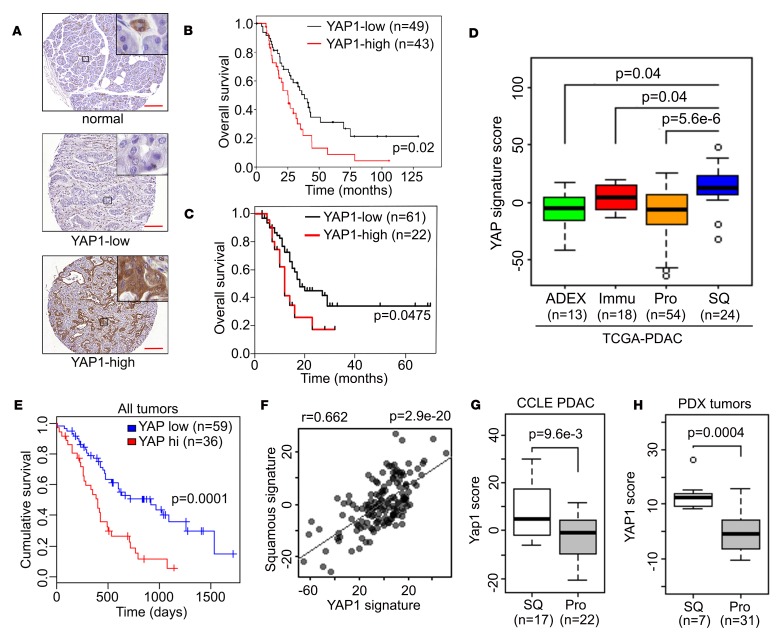
Figure 1. YAP1 is activated in the squamous subtype of human PDAC.
(A) Representative images of YAP1 TMA showing tumor adjacent normal pancreatic tissue or tumor samples with low/high YAP1 level. Scale bar: 200 μm. (B and C) Kaplan-Meier curves for overall survival in patients with PDAC from MD Anderson (B) or Johns Hopkins University School of Medicine (C) stratified by YAP1 expression. (D) YAP1 signature score among human PDAC subtypes in The Cancer Genome Atlas (TCGA) data set. ADEX, aberrantly differentiated endocrine exocrine subtype; Immu, immunogenic subtype; Pro, progenitor subtype; SQ, squamous subtype. (E) Kaplan-Meier curves for overall survival in all patients with PDAC from TCGA data set stratified by YAP1 activation signature score. (F) Correlation between squamous subtype signature and YAP1 signature in PDAC TCGA data set. (G and H) YAP1 signature score in squamous or progenitor subtype human PDAC cell lines (G) or PDXs (H). The box plots depict the minimum and maximum values (whiskers), the upper and lower quartiles, and the median. The length of the box represents the interquartile range. Error bars for all panels indicate ± SD. P value for survival analysis was calculated with log-rank test.

