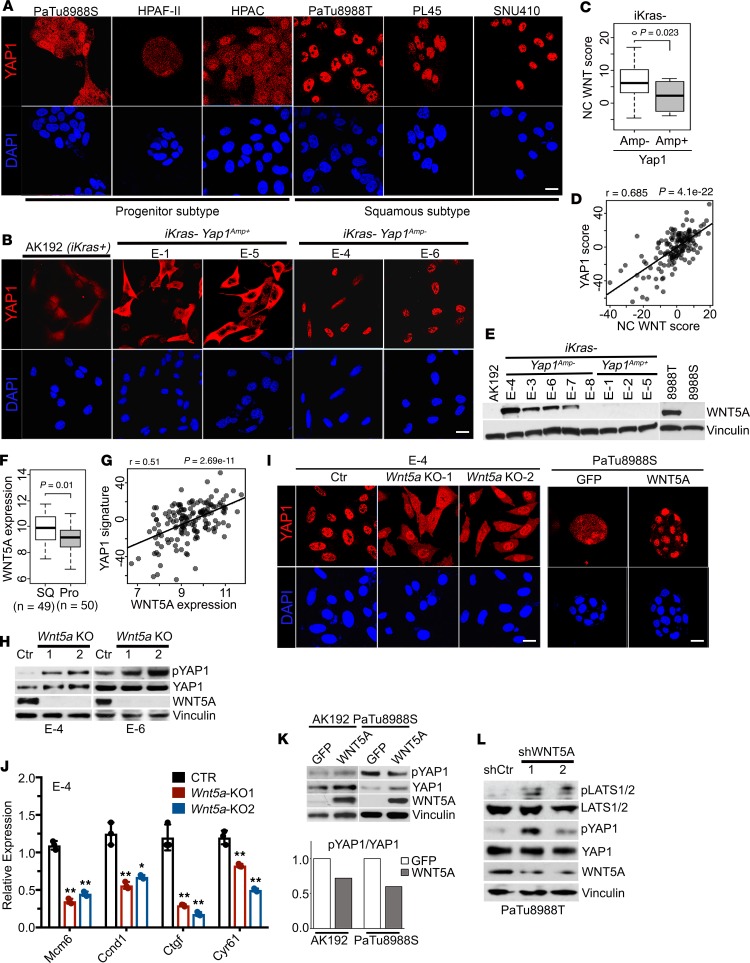
Figure 3. YAP1 activation in PDAC is mediated by WNT5A overexpression.
(A and B) Human pancreatic cancer cell lines of progenitor or squamous subtype (A) or mouse PDAC cells of indicated genotypes (B) were subjected to immunofluorescence staining with anti-YAP1 (red) and DAPI (blue). (C) Noncanonical (NC) WNT pathway enrichment score in iKras– mouse PDAC tumors without (Amp–) or with (Amp+) Yap1 amplification. (D) Correlation between NC WNT signature and YAP1 signature in PDAC TCGA data set. (E) Western blots for WNT5A in mouse PDAC cells of indicated genotypes and human PDAC cell lines. (F) WNT5A expression in squamous or progenitor subtype human PDACs in TCGA data set. (G) Correlation between WNT5A expression and YAP1 signature in PDAC TCGA data set. (H) Western blot analysis for WNT5A, YAP1, and phospho-YAP1 (S127) in 2 independent iKras-Yap1Amp– cells with CRISPR-mediated Wnt5a deletion. Two independent Wnt5a-knockout (KO) clones were included, and a clone without Wnt5a deletion was used as a control (Ctr). Vinculin blot for E-4 was run in parallel with the rest of the blots for E-4 contemporaneously. (I) E-4 (iKras-Yap1Amp–) Wnt5a-KO cells and PaTu8988S cells expressing GFP or WNT5A were subjected to immunofluorescence staining with anti-YAP1 (red) and DAPI (blue). (J) Relative mRNA levels of YAP1 downstream targets in E-4 (iKras– Yap1Amp–) Wnt5a-KO cells. P value was corrected with Dunnett’s method. (K) Western blot analysis for WNT5A, YAP1, and phospho-YAP1 (S127) in mouse iKras PDAC cells (AK192) or human PaTu8988S cells expressing GFP or WNT5A (top). The quantification of phospho-YAP1/total YAP1 signals is shown. (L) Western blot analysis for WNT5A, LATS1/2, phospho-LATS1/2, YAP1, and phospho-YAP1 (S127) in PaTu8988T cells infected with WNT5A shRNAs or nontargeting shRNA (shCtr). The box plots depict the minimum and maximum values (whiskers), the upper and lower quartiles, and the median. The length of the box represents the interquartile range. Error bars from all panels indicate ± SD. *P < 0.05; **P < 0.01. Scale bar: 20 μm.

