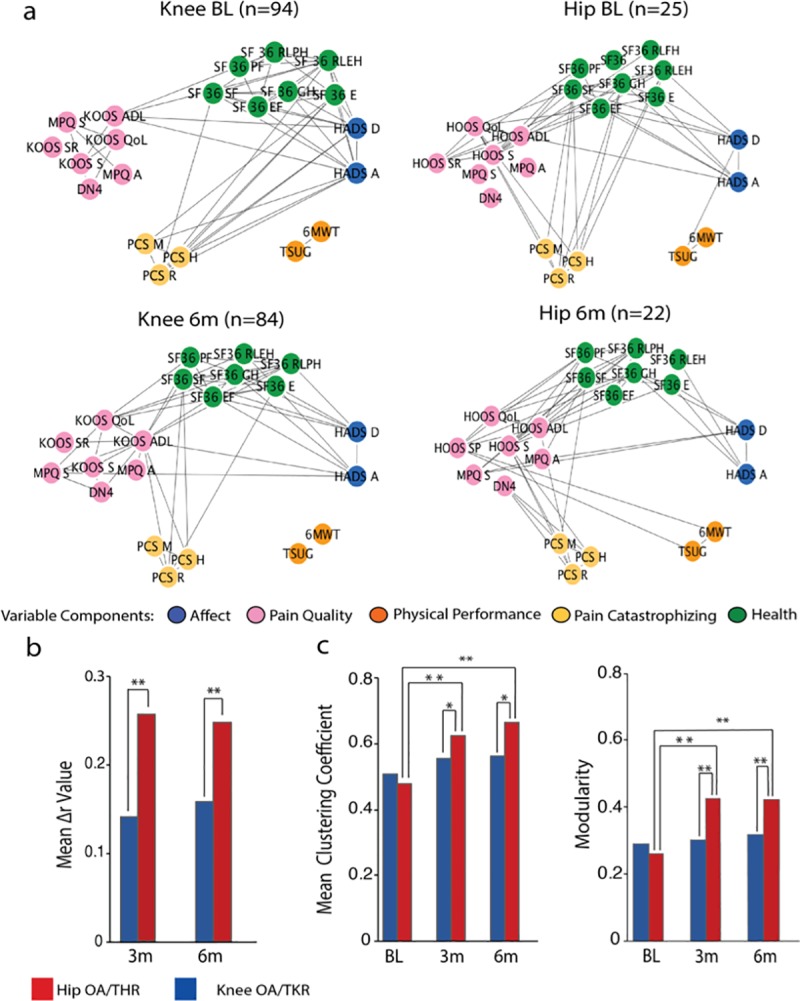
Fig 5. Network representation of OA pain characteristics.

a) Network graphs depict interrelations between clinical and pain-related questionnaire subscale measures at baseline, and at 6 months post-surgery, for KOA and HOA patients. Network communities were derived from the PCA analysis. Links represent the top 25% correlations of each network. b) The bar graph displays mean change of global correlation coefficients (Pearson’s Δr) for KOA and HOA, at 3- and 6-months post-surgery. Both groups had significant change in the overall interrelations between clinical and pain-related characteristics (KOA mean Δr 3months: 0.14, t = 13.37, mean Δr 6months: 0.16 t = 14.93, HOA mean Δr 3months:0.28, t = 8.72, mean Δr 6months:0.26 t = 9.23, p<0.001). The extent of change remained stable from 3 to 6 months post-surgery and was substantially higher in the HOA group at 3 months (t = 4.62, p<0.001) and 6 months (t = 3.44, p<0.001). c) Graph theory-based modularity and mean clustering coefficients for correlation networks at baseline, 3 and 6 months. The HOA networks shows significant topological reorganization 3 months (mcc: t = -8.19, modularity: t = -9.22, p<0.001) and 6 months after surgery (mcc, t = -10.62, modularity, t = -9.02, p<0.001), while KOA remains stable. BL, baseline; 3m, 3 months; 6m, 6 months; Statistical risk probability was computed under 10.000 times repeated random resampling. **p<0.001, *p<0.05.
