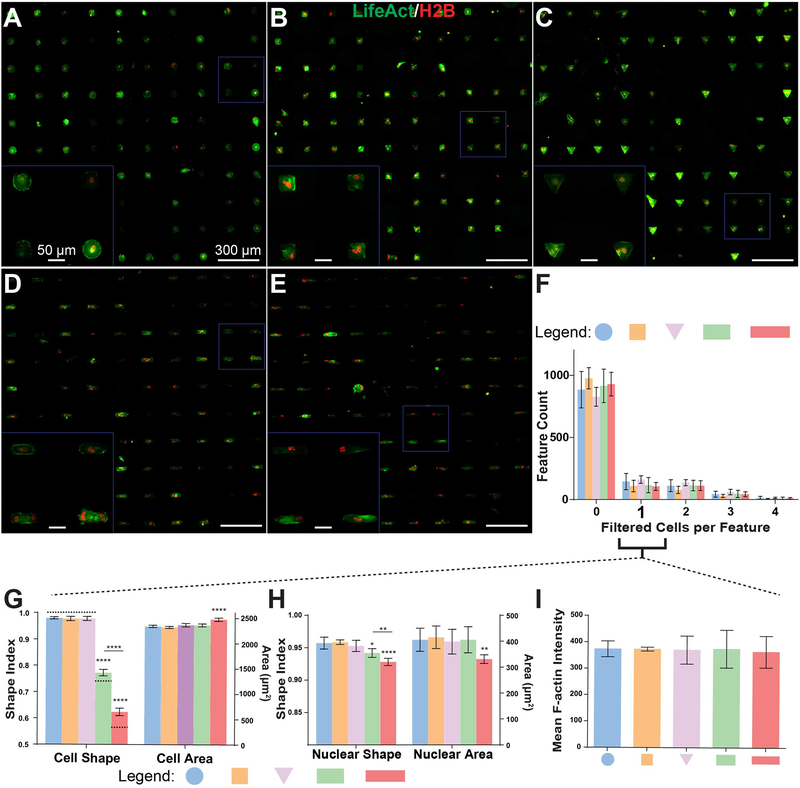
Figure 3. Cell attachment and patterning on μCP Well Plates.
A-E) 20x stitched images of H2B-mCherry- and LifeAct-GFP-labeled human fibroblast lines (H2B-LA) attached to circular (A), square (B), triangular (C), compact rectangular (D), and elongated rectangular (E) single-cell features. Cells were seeded 16 hours prior to imaging and analysis. F) Distribution of cells contained by each feature after automated removal of cells that do not meet user-specified area and shape criteria. “0” filtered cells columns correspond to the sum of both empty features and features containing cells eliminated by filtering. G-H) SI (left Y-axis) and area (right Y-axis) measurements for cell bodies (H) and nuclei (I) of features containing a single cell after filtering. Dashed bars in (H) indicate theoretical SI values for each shape. I) Mean LifeAct fluorescent intensity (averaged per-pixel across filtered LifeAct features) of patterned single-cells. All error bars denote 95% confidence intervals. Unless otherwise denoted, asterisks indicate p values from unpaired Student’s t-test compared to data from circular features (*p<0.05, **p<0.01, ***p<0.001, ****p<0.0001). Each bar represents data aggregated from 5 to 8 wells of a 24-well plate across two biological replicate experiments.

