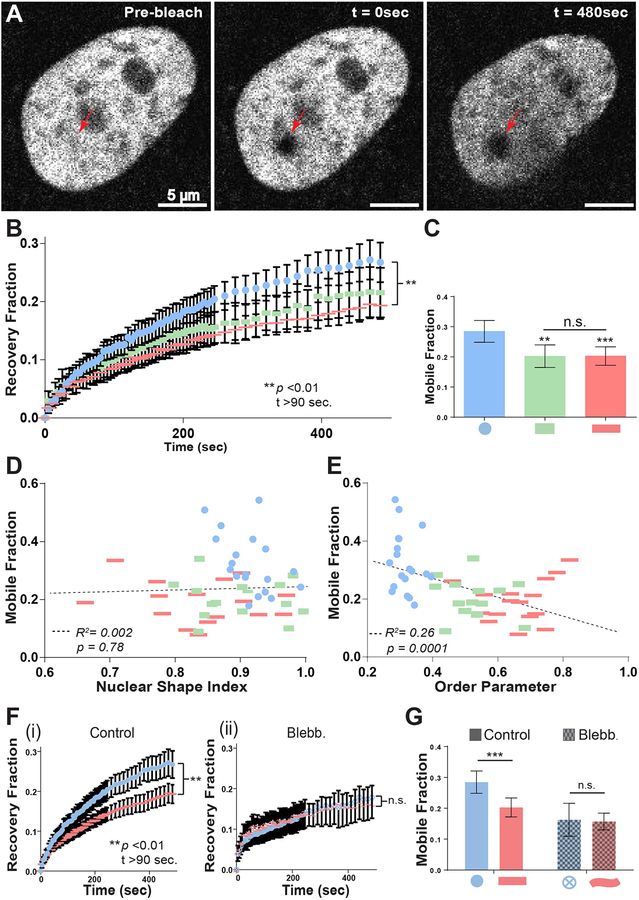
Figure 5. FRAP analysis of patterned single-cells.
A) Representative images of H2B-mCherry-labeled nuclei immediately before and after photobleaching, and at the end of the 8-minute recovery period. Arrowheads denote ~1 μm diameter photobleached area. Intensity measurements were collected every five seconds for four minutes following photobleaching, and every 15 seconds for four more minutes thereafter, and normalized to the intensity of the entire nucleus. B) Quantification of fluorescent recovery fraction in nuclei of patterned single-cells. (n=20 for compact rectangles, n=40 for circles and elongated rectangles) C) Mobile fraction of patterned single-cells. Mobile fraction was calculated as the plateau of one-phase association curve fit to the recovery fraction time course. D-E) Single-cell scatter plots of nuclear shape index (D) or order parameter (E) vs. mobile fraction. Dashed lines represent linear regression best-fit lines. p values for best-fit lines were calculated from F-tests and indicates the probability that the slopes of the regression lines are equal to zero. F) Quantification of fluorescent recovery fraction in nuclei of control (i), (n=40) and blebbistatin-treated (ii), (n=20) patterned single-cells. (50 μM, 60–120 min exposure) G) Mobile fraction of control and blebbistatin-treated patterned single-cells. All error bars denote 95% confidence intervals. Asterisks indicate p values from unpaired Student’s t-test (*p<0.05, **p<0.01, ***p<0.001, ****p<0.0001).

