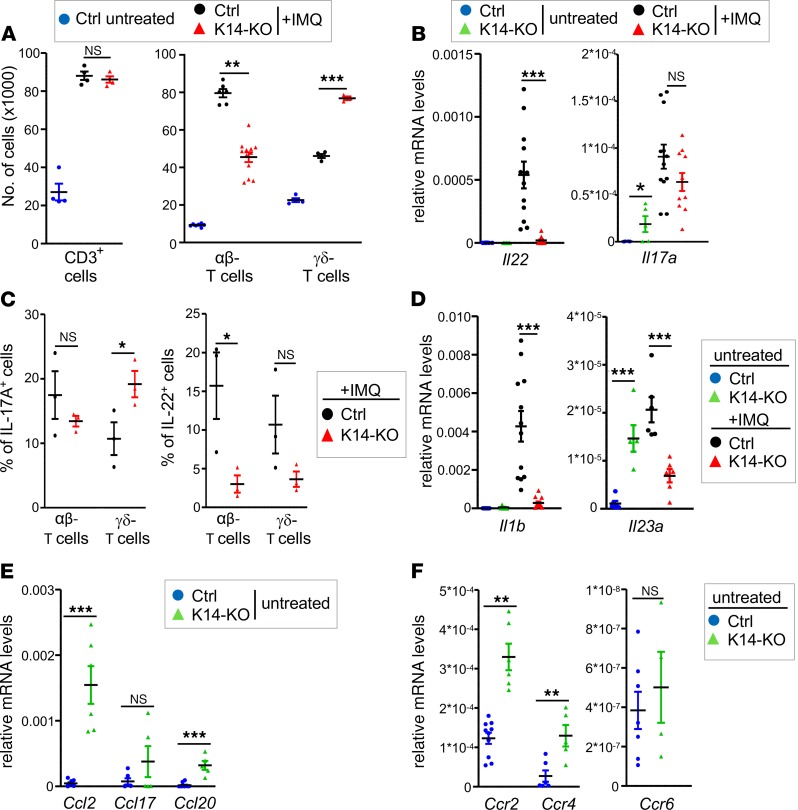
Figure 3. Analysis of skin-infiltrating T cells in IMQ-treated K14-IκBζ–KO mice.
All analyses were performed after 7 days of IMQ treatment. (A) Flow cytometry analysis of T cell subsets in the ears of IMQ-treated Ctrl and K14-KO mice. T cell subsets were detected as CD45+ and CD3+, αβTCR+, or γδTCR+ cells. Single data points derive from 2 ears. Shown is the mean of 4–12 mice per group ± SEM. (B) Gene expression analysis of Il22 and Il17a in skin tissue of untreated and IMQ-treated control and K14-KO mice, normalized to the reference gene Actin. n = 4–14 ± SEM. (C) Determination of the percentage of IL-17A– and IL-22–producing αβ and γδ T cells in IMQ-treated control and K14-KO mice. After fixation and permeabilization, cells were gated as in A, except for an additional gating on either IL-17A+ or IL-22+ cells. n = 3 ± SEM. (D) Gene expression analysis of Il1b and Il23a in untreated and IMQ-treated mice, similar as in B. (E) mRNA levels of Ccl2, Ccl17, and Ccl20 in untreated mice, similar as in B. (F) mRNA levels of Ccr2, Ccr4, and Ccr6 in the skin of untreated control and K14-KO mice, similar as in B. n = 5–14 ± SEM. P values were calculated using 2-tailed Student’s t test (*P < 0.05, **P < 0.01, and ***P < 0.001).

