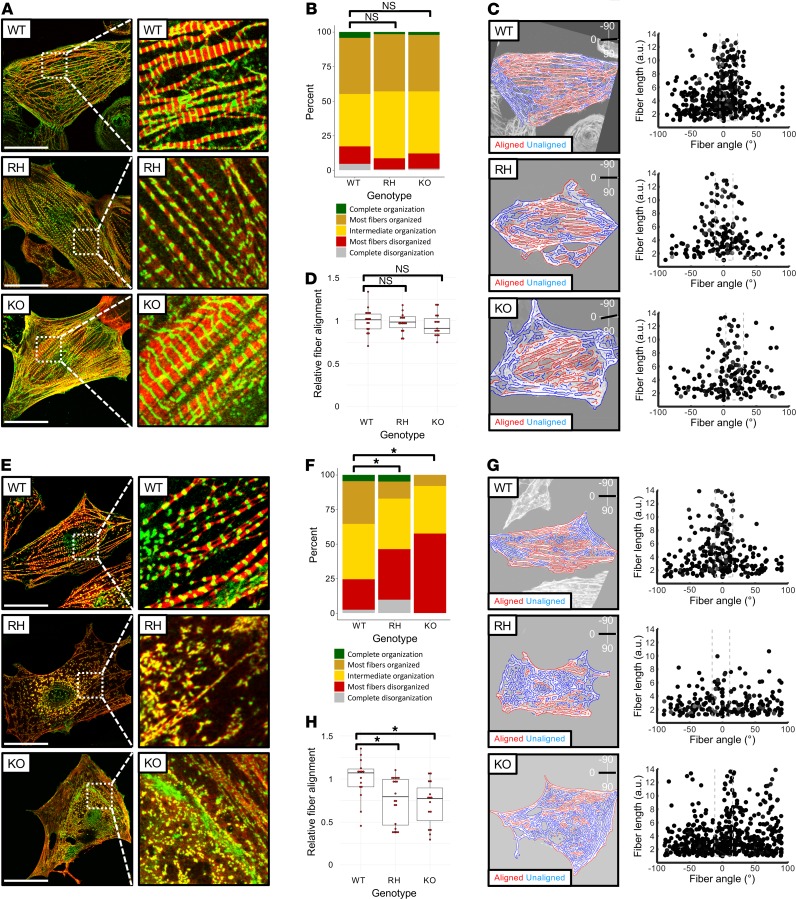
Figure 2. Proteasome inhibition causes myofibrillar disarray in BAG3-R477H and BAG3-KO induced pluripotent stem cell–derived cardiomyocytes (iPSC-CMs).
(A) Visualization of myofibrillar organization in unedited (WT), BAG3-R477H knock-in (RH), and BAG3-KO (KO) iPSC-CMs, maintained under standard culture conditions. Red, cardiac troponin T; green, α-actinin. (B) Quantification of myofibrillar disorganization/organization in BAG3-WT, BAG3-RH, and BAG3-KO iPSC-CMs based on manual classification (n > 150 cells per genotype). (C) Quantification of myofibrillar disorganization/organization in BAG3-WT, BAG3-RH, and BAG3-KO iPSC-CMs from corresponding cells in A. Left panels show individual myofiber boundaries (identified from cardiac troponin channel) defined using an edge detection algorithm in MATLAB (see Methods) and are displayed as red or blue if aligned or unaligned, respectively, with the predicted long axis of the parent cell, indicated in the top right corner. Right panels display each myofiber from the corresponding parent cell (left panels) as a single point and are plotted according to their length (y axis) and angle relative to the predicted long axis (x axis) of the parent cell. The dashed box represents ±15°of the predicted long axis of the cell. (D) Relative myofiber alignment based on edge detection measurements in BAG3-WT, BAG3-RH, and BAG3-KO iPSC-CMs. E–H are as described in A–D, respectively, but with the addition of MG132 (25 μM, 15 hours). In A and E, scale bar: 20 μm. In D and H, each data point represents average myofiber alignment from a single cell. For each genotype, 15 randomly selected cells were analyzed. Boxplots show median and interquartile range (IQR), whiskers extend 1.5 times the IQR, and individual data points are displayed as red points. *P < 0.05 (unpaired 2-tailed t test) following Bonferroni correction for multiple comparisons. Images in A and E display representative cells from 1 experiment, and data are representative of 3 independent experiments.

