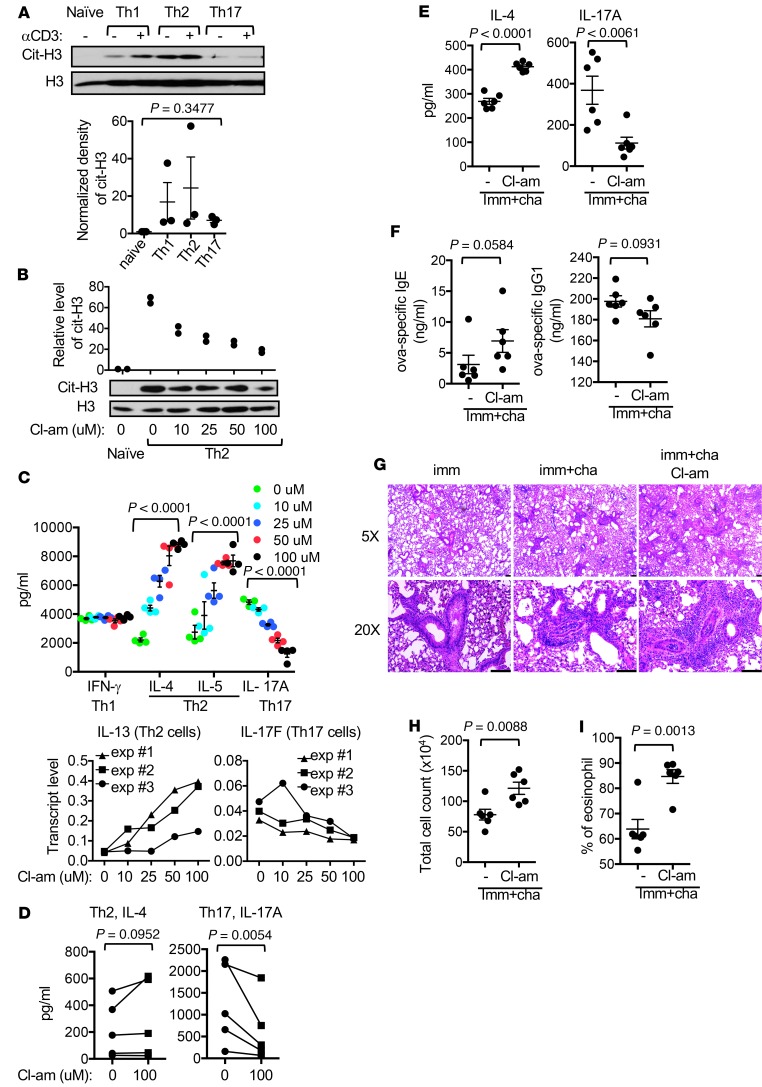
Figure 1. Modulation of in vivo and in vitro differentiation of Th cells by global inhibition of citrullination.
(A) Indicated C57BL/6 Th cells were left unstimulated (–) or restimulated with anti-CD3 (+) overnight. The level of cit-H3 was examined with Western blotting using anti–cit-H3. The normalized density of cit-H3 is shown in the bar graph (n = 3, 1-way ANOVA). (B and C) C57BL/6 effector Th cells were generated in the presence of Cl-am at indicated concentrations for 5 days. Whole Th2 extract was examined with Western blotting using indicated antibodies. Representative blots and normalized density of cit-H3 from 2 experiments are shown in B. The expression of indicated cytokines by the Th cells after restimulation with anti-CD3 is shown in C (n = 4, 1-way ANOVA). (D) Primary human Th cells from 5 healthy donors were differentiated in vitro into Th2 or Th17 cells in the presence or absence of Cl-am (100 μM). The production of IL-4 and IL-17A after restimulation with anti-CD3 was quantified with ELISA. Data points from the same donors are connected with lines (1-tailed paired Student’s t test). (E–I) Allergic airway inflammation was induced in C57BL/6 mice (n = 6 per group) in the absence or presence of Cl-am. Splenocytes were restimulated with ovalbumin for 72 hours. The levels of IL-4 and IL-17A in supernatant are shown in E. Imm, immunized; cha, challeneged. The levels of ovalbumin-specific (ova-specific) IgE and IgG1 in serum are shown in F. Representative H&E staining of the lung tissue is shown in G. Scale bars: 100 μm. The total number of cells (H) and the percentage of eosinophils (I) in bronchial lavage are also shown. Statistical analysis for E, F, H, and I was performed with 2-tailed Student’s t test.

