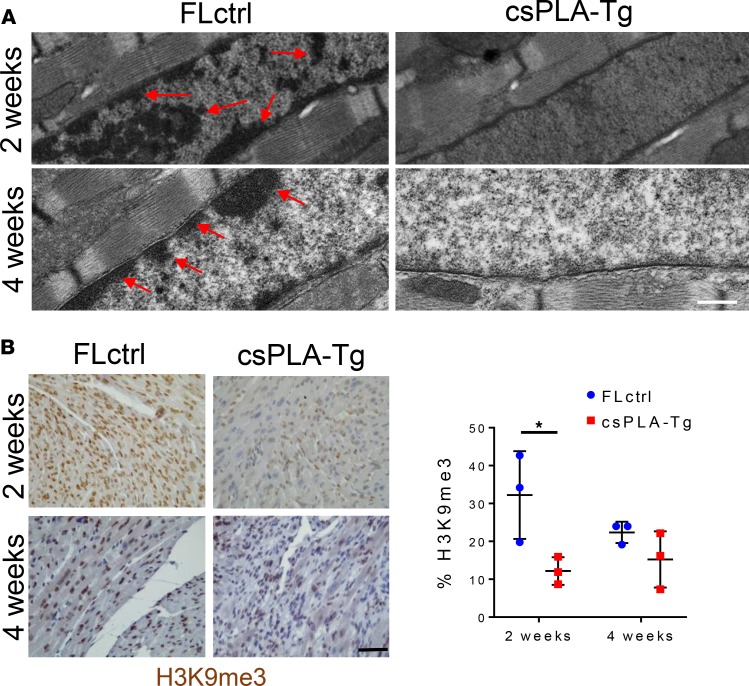
Figure 8. Prelamin A accumulation resulted in loss of heterochromatin and H3K9me3 repressive histone marks in the myocardium of 2-week-old mice.
(A) Representative electron micrographs show heterochromatin displacement and loss of chromocentres. Scale bar: 500 nm. Arrows indicate regions of condensed chromatin. (B) Quantitative IHC showed a profound loss of H3K9me3 staining as a percentage of total Hematoxylin stain in 2-week-old csPLA myocardium. Scale bar: 30 μm. Values are mean ± SD. n = 3 females/group. Two-way ANOVA, no repeated measures, with Sidak’s test for multiple comparisons was performed.*P < 0.05.

