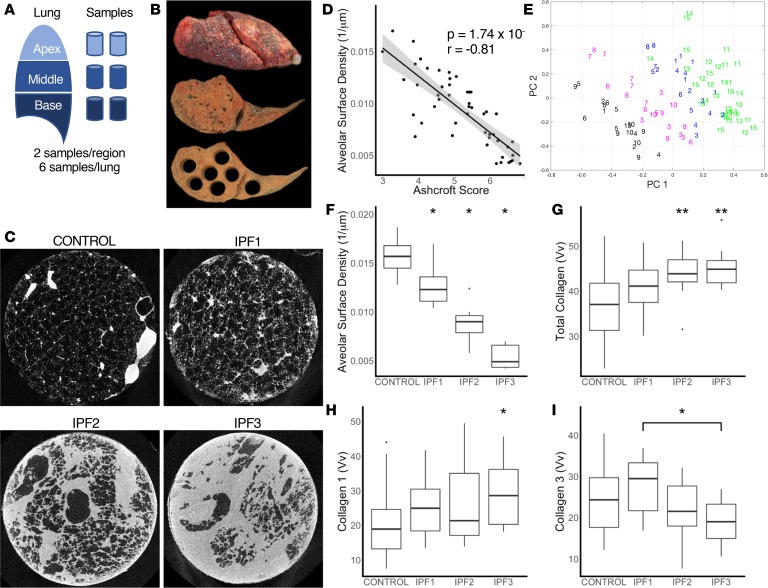
Figure 1. Sampling of the lung.
(A) Schematic for sampling of the lung. (B) Image of the inflated whole IPF lung with a slice taken before and after sampling. (C) Representative microCT images of a control sample and for each stage of IPF. (D) A significant negative correlation (r = –0.81, P = 1.74 × 10⁻¹²) was found between alveolar surface density (ASD) compared with Ashcroft scores. Gray area represents the 95% confidence interval. (E) Principal component and expectation-maximization clustering separated samples into control (green) and early-stage (IPF1; blue), progressive (IPF2; magenta), and end-stage (IPF3; black) IPF. Each subject is identified by number (IPF: 1–10; control: 11–16). (F) ASD was significantly reduced in IPF stages compared with control but a large overlap remained between IPF1 and control. (G) Volume fraction (Vv) of total collagen was significantly increased in IPF2 and IPF3 stages compared with control. (H) Collagen 1 Vv was significantly increased in IPF3 compared with controls. (I) Collagen 3 Vv showed no difference compared to control but a significant decrease in IPF1 compared with IPF3. For panels F–I, data are presented as box plots showing median and interquartile ranges for each group compared using linear mixed-effects models. *P < 0.05; **P < 0.001.

