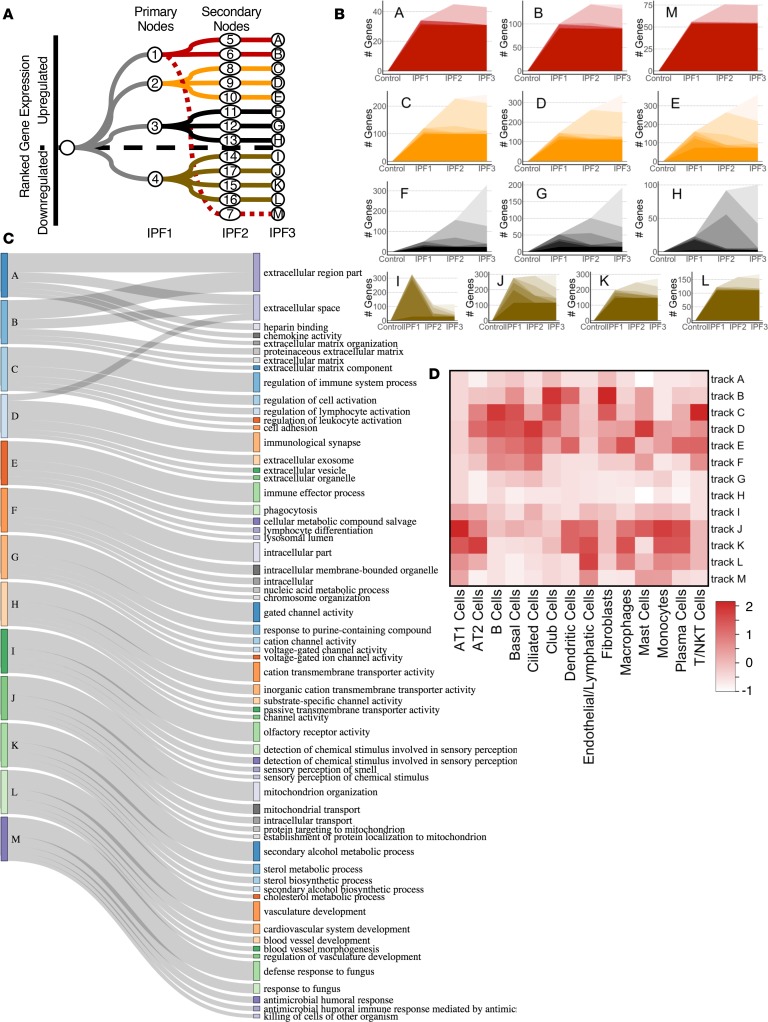
Figure 3. DREM tracks at each stage of IPF.
(A) Flow diagram showing the 4 primary tracks established in IPF1 which split into 13 secondary tracks in the IPF2 stage. Numbers denote regulatory node for that junction where regulators and gene expression diverge. Letters denote track name. (B) Number of differentially expressed genes for each track at each stage of IPF. (C) Sankey diagram of biological function terms identified for each DREM track. (D) Heatmap of enriched genes between DREM tracks and a published IPF single-cell gene marker list scaled to the number of genes per cell type (40).

