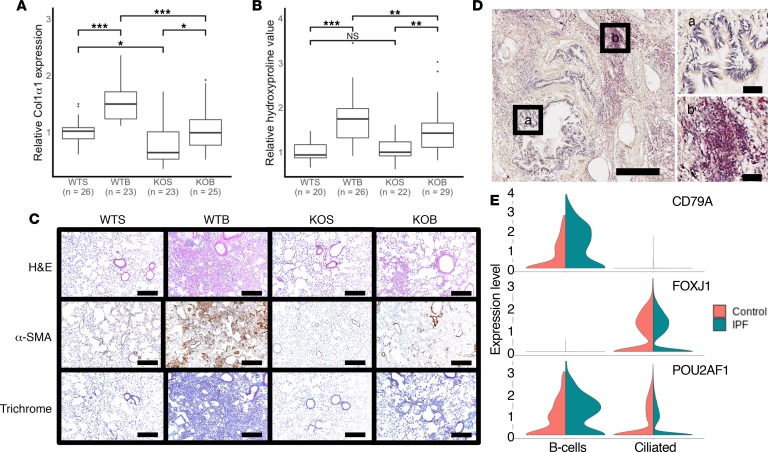
Figure 4. Pou2af1–/– mice show less fibrotic severity in bleomycin-induced lung fibrosis.
(A) qRT-PCR analysis of relative change in collagen type I, α1 (Col1α1) mRNA levels in wild-type (Pou2af1+/+) and Pou2af1–/– mice on day 14 after treatment with saline or bleomycin. Data are presented as box plots showing median and interquartile ranges for each group, with groups compared using linear mixed-effects models. Wild-type saline (WTS) n = 26; wild-type bleomycin (WTB) n = 23; Pou2af1-knockout saline (KOS) n = 23; and Pou2af1-knockout bleomycin (KOB) n = 25. (B) Relative collagen deposition assessed by hydroxyproline content per right lung in wild-type (Pou2af1+/+) and Pou2af1–/– mice as indicated by treatment groups. Data are shown as box plots with median and interquartile ranges and compared using linear mixed-effect models. WTS n = 20; WTB n = 26; KOS n = 22; and KOB n = 29. (C) H&E staining (upper panels), α-SMA (middle panels), and Masson’s trichrome (lower panels) staining of representative lung sections (n = 2 per group). Scale bars: 200 μm. (D) POU2AF1 immunostaining (red) in human IPF lung tissue showed no staining in bronchial epithelium (a) but lymphocytic aggregates (b) were positive. Scale bars: 400 μm (left) or 50 μm (right 2 images). (E) Violin plots from single-cell RNA-sequencing data of control (orange) and IPF (green) lung tissues showing specific cell types expressing POU2AF1. Upper panel shows CD79 expression identifying the B cell population, middle panel shows FOXJ1 expression identifying the ciliated epithelial cell population. POU2AF1 (bottom panel) was highly expressed in CD79 expressing B cells with some expression in ciliated epithelium (FOXJ1). In IPF, POU2AF1 showed increased expression in B cells and a slight reduction of expression in the ciliated cells. *P < 0.05, **P < 0.001, ***P < 0.0001, ns = no significance.

