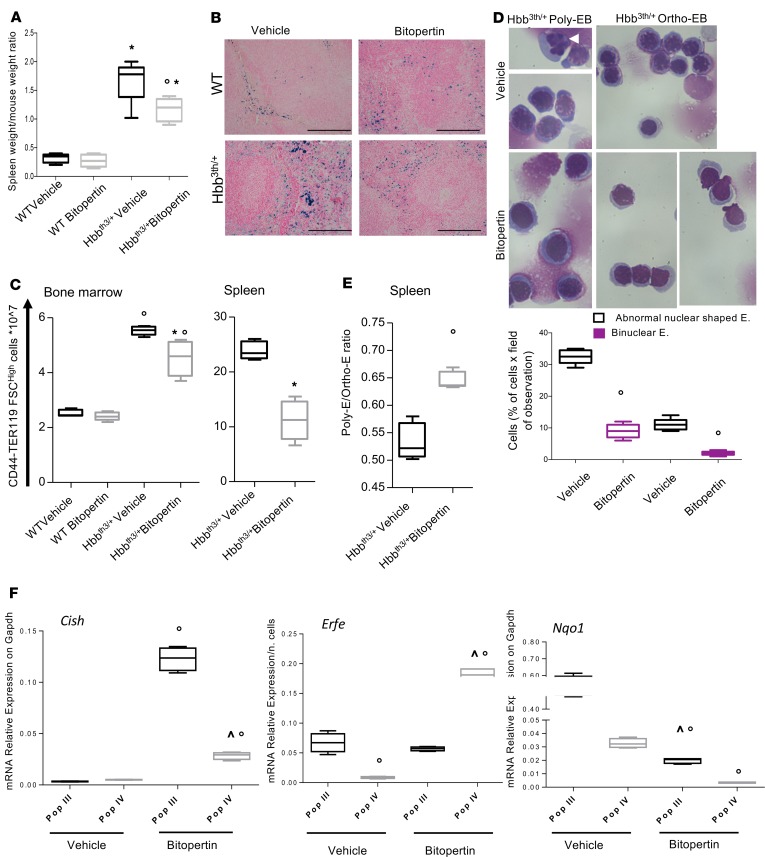
Figure 2. Bitopertin reduces β-thalassemic ineffective erythropoiesis.
(A) Spleen weight/mouse weight ratio in WT and Hbbth3/+ mice with and without bitopertin treatment (30 mg/kg/d, 28 days). Data are presented as median and minimum/maximum (n = 6); *P < 0.05 compared with WT mice; °P < 0.05 compared with vehicle-treated group; Mann-Whitney U test with multiple-comparisons corrections. (B) Iron staining (Pearl’s Prussian blue) in spleens from WT and Hbbth3/+ mice with and without bitopertin treatment (30 mg/kg/d, 28 days). One representative image from the other 6 with similar results is presented. Original magnification, ×200. See Supplemental Figure 2A for quantitative results of iron staining on Pearl’s Prussian blue. (C) Flow cytometric analysis combining CD44-Ter119 and cell size marker strategy (CD44+Ter119+Fschi) on bone marrow and spleens from WT and Hbbth3/+ mice with and without bitopertin treatment (28 days). Data are presented as median and minimum/maximum (n = 3); *P < 0.05 compared with WT mice; °P < 0.05 compared with vehicle-treated mice; 2-way ANOVA with Holm-Šídák test for multiple comparisons. (D) Upper: Morphology of sorted erythroid cells from Hbbth3/+ mice with and without bitopertin treatment (30 mg/kg/d, 28 days). Cytospins were stained with May-Grünwald-Giemsa. Cells were imaged under oil at original magnification ×100 using a Panfluor objective with 1.30 numeric aperture on a Nikon Eclipse DS-5M camera and processed with Digital Slide (DS-L1) Nikon. We show 1 representative image from a total of 6. Erythroblasts with abnormal nuclear shape and binuclear erythroblasts (white arrowhead) from Hbbth3/+ mice evaluated on cytospin stained with May-Grünwald-Giemsa. Lower: Data are presented as median and minimum/maximum (n = 6); °P < 0.05 compared with vehicle-treated group; 2-way ANOVA with Holm-Šídák test for multiple comparisons. (E) Box plot showing the ratio between polychromatic/orthochromatic erythroblasts used as a maturation index in spleens analyzed by flow cytometry from Hbbth3/+ mice with and without bitopertin treatment (30 mg/kg/d, 28 days). Data are presented as median and minimum/maximum (n = 6); °P < 0.05 compared with standard diet; 2-way ANOVA with Holm-Šídák test for multiple comparisons. (F) mRNA expression by real-time reverse transcription PCR (qRT-PCR) of Cish, NAD(P)H quinone-1 (Nqo1), and erythroferrone (Erfe; Fam132b normalized on number of sorted cells in each subpopulation) genes on sorted polychromatic erythroblasts (Pop III) and orthochromatic erythroblasts (Pop IV) from bone marrow of WT and Hbbth3/+ mice with and without bitopertin treatment (30 mg/kg/d, 28 days). Experiments were performed in triplicate. Data are presented as median and minimum/maximum; °P < 0.05 compared with vehicle; ^P < 0.05 Pop IV vs. Pop III; Mann-Whitney U test with multiple-comparison corrections.

