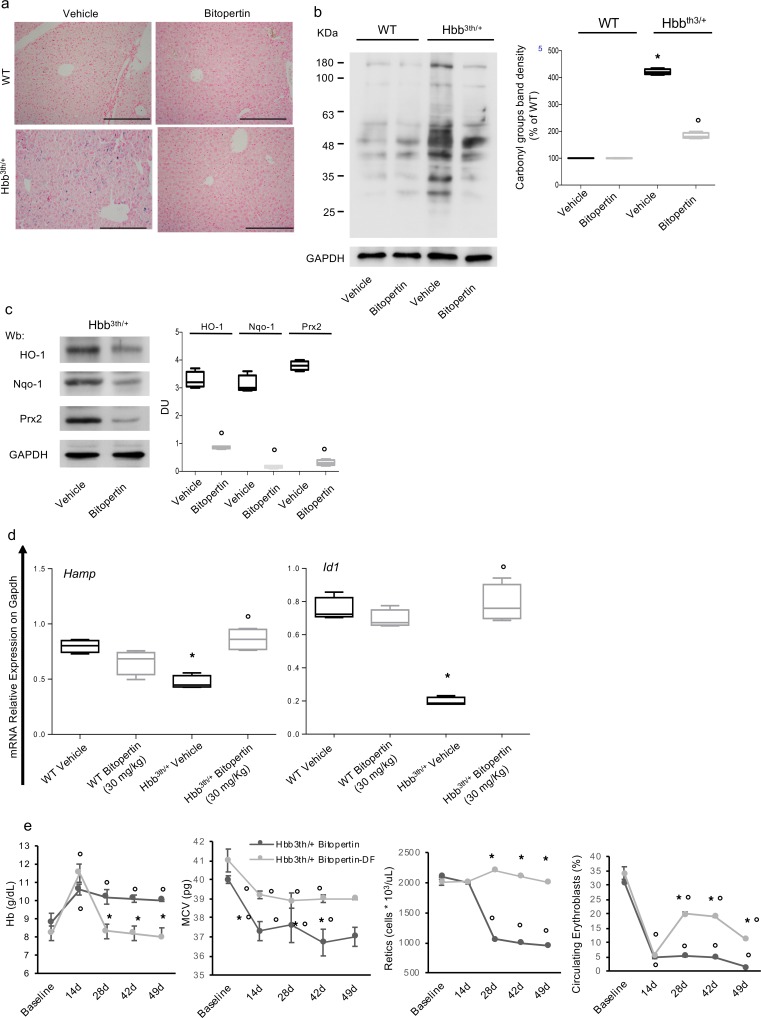
Figure 3. In β-thalassemic mice, bitopertin reduces liver iron overload and oxidative stress with associated upregulation of hepcidin.
(A) Iron staining (Pearl’s Prussian blue) in liver from WT and Hbbth3/+ mice with and without bitopertin treatment (28 days). One representative image from the other 3 with similar results is presented (quantification of iron staining is shown in Supplemental Figure 2E). Original magnification, ×200. (B) Soluble fractions of liver from WT and Hbbth3/+ mice with and without bitopertin treatment (30 mg/kg/d, 28 days). The samples were analyzed on 12% SDS-PAGE and subjected to OxyBlot. The carbonylated proteins (1 mg) were detected by treating with 2,4-dinitrophenylhydrazine and blotted with anti-DNP antibody. Quantification of band area was performed by densitometry and expressed as percentage of WT (right). The data are presented as median and minimum/maximum of at least 5 experiments; *P < 0.05 compared with WT; °P < 0.05 compared with vehicle; 2-way ANOVA with Holm-Šídák test for multiple comparisons. (C) Left: Western blot (Wb) analysis with specific antibodies against heme oxygenase (HO-1), NAD(P)H quinone-1 (Nqo1), and peroxiredoxin-2 (Prx2), of liver from Hbbth3/+ mice with and without bitopertin treatment (30 mg/kg/d, 28 days). One representative gel from 6 with similar results is presented. Right: Densitometric analysis of immunoblots is shown in the box plot. Data are presented as median and minimum/maximum; °P < 0.05 compared with vehicle; 2-way ANOVA with Holm-Šídák test for multiple comparisons. DU, densitometric units. (D) mRNA expression by qRT-PCR of hepcidin (Hamp) and Id1 genes on liver from WT and Hbbth3/+ mice with and without bitopertin treatment (30 mg/kg/d, 28 days). Experiments were performed in triplicate. Error bars represent the SDs, median, and minimum/maximum; *P < 0.05 compared with WT; °P < 0.05 compared with vehicle; 2-way ANOVA with Holm-Šídák test for multiple comparisons. (E) Hb, mean cell volume (MCV), reticulocyte count, and circulating erythroblasts in WT Hbb3th/+ mice under either bitopertin or bitopertin plus deferiprone (DFP) treatment. Data are presented as mean ± SD; *P < 0.05 compared with bitopertin-treated mice; °P < 0.05 compared with baseline values; Wilcoxon’s signed-rank test for multiple comparisons.

