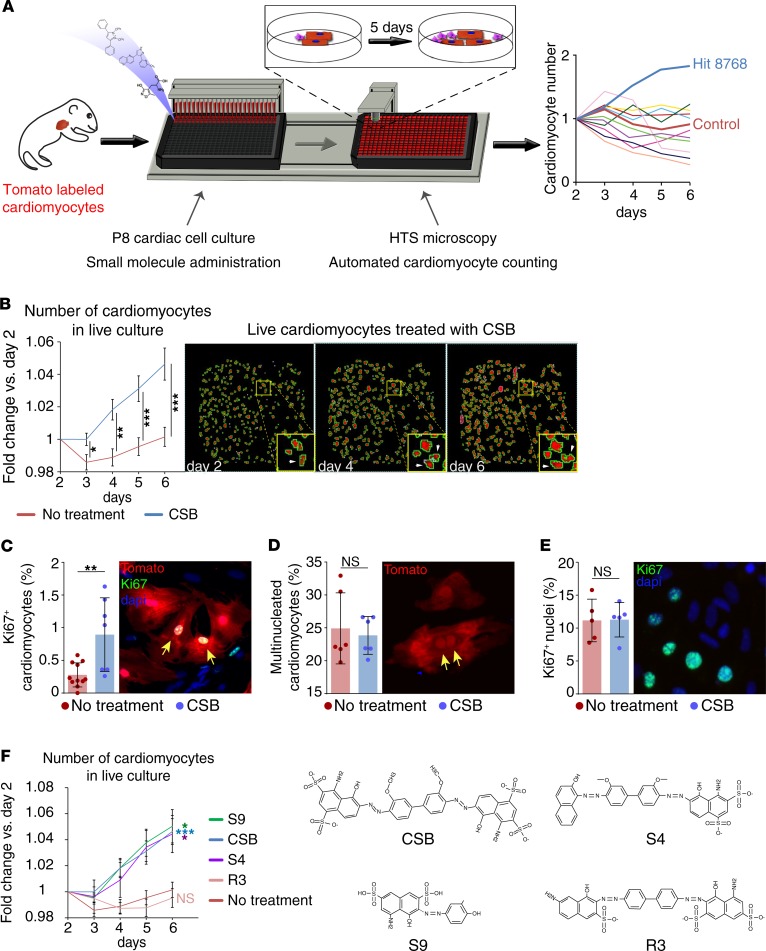
Figure 1. Small-molecule screen identifies Chicago Sky Blue 6B as a molecule that induces cardiomyocyte proliferation.
(A) Schematic representation of the high-throughput screening system. P8 cardiac cells were plated in 384-well plates and introduced to different small molecules. Using automated high-throughput microscopy, the cardiomyocytes in each well were counted daily and compared to the number of cardiomyocytes in the same well in the beginning of the experiment. (B) Repeated measurements for validation of the screen results. Number of P8 cardiomyocytes in live culture relative to day 2 (no treatment, n = 20; Chicago Sky Blue 6B [CSB], n = 16; data are presented as mean ± SEM, unpaired 2-tailed Student’s t test). (C) Percentage of Ki67+ P8 cardiomyocytes normalized to total cardiomyocytes after 4-day incubation with CSB (no treatment, n = 11; CSB, n = 7; mean ± SD, unpaired 2-tailed Student’s t test). (D) Percentage of multinucleated P8 cardiomyocytes normalized to total cardiomyocytes after 4-day incubation with CSB (n = 6 for each group, mean ± SD, paired 2-tailed Student’s t test). (E) Percentage of Ki67+ nuclei normalized to total nuclei in P8 cardiac cells after 4-day incubation with CSB (n = 5 for each group, mean ± SD, paired 2-tailed Student’s t test). (F) Number of P8 cardiomyocytes in live culture relative to day 2. Cells were treated with compounds that share structural similarity with CSB (no treatment, n = 20; CSB, n = 16; S9, n = 4; S4, n = 6; R3, n = 3; mean ± SEM, 1-way ANOVA and Dunnett’s post hoc test). The colored asterisks represent the significance of the difference for each compound from the nontreated culture. The data for no treatment and CSB-treated cultures in panels B and F are an average of the same samples. For all panels: *P < 0.05, **P < 0.01, ***P < 0.001. NS, not significant.

