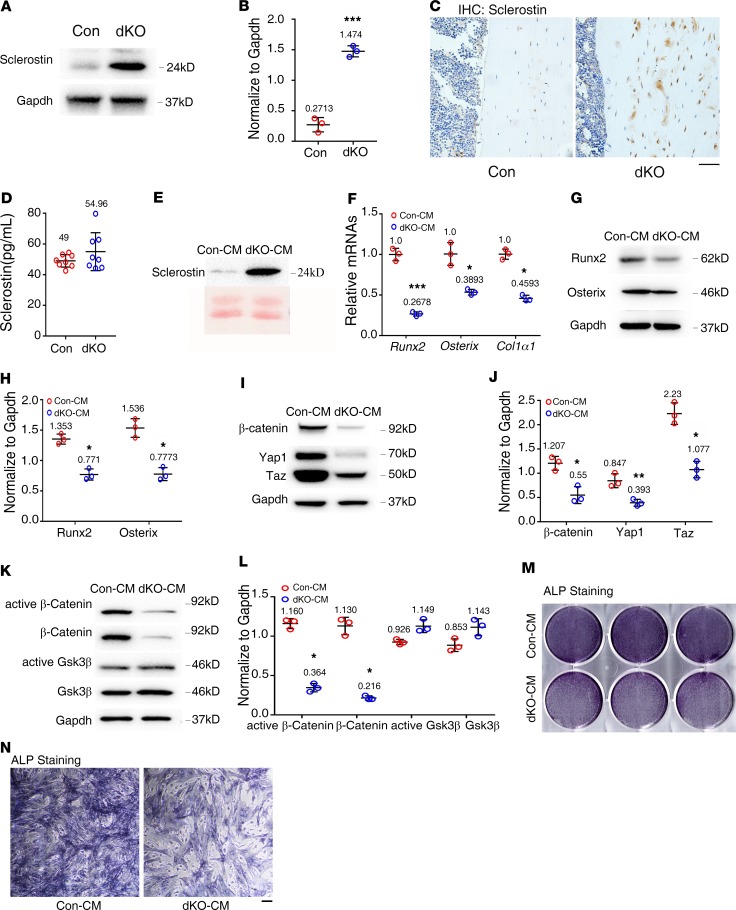
Figure 5. Pinch loss increases sclerostin expression in osteocytes and indirectly suppresses osteoblast differentiation.
(A) Western blot analyses. Protein extracts were isolated from femurs of 6-month-old female control and dKO mice and subjected to Western blotting using an antibody against sclerostin. (B) Quantitative data. n = 3 mice per group. Unpaired Student’s t test. Results are expressed as mean ± SD. (C) IHC staining of tibial sections of 6-month-old female control and dKO mice with an antibody against sclerostin. Scale bar: 50 μm. (D) Serum level of sclerostin. Sera were obtained from 6-month-old female control and dKO mice and subjected to ELISA assay for sclerostin. n = 8 mice per group. Unpaired Student’s t test. Results are expressed as mean ± SD. (E) Western blot analysis. Middiaphyseal femoral shafts (with their BM flushed) of 6-month-old female control and dKO mice were cut into small pieces and cultured in serum-free α-MEM supplemented with 1% penicillin/streptomycin for 48 hours and conditioned media (CM) were collected for Western blotting with an antibody against sclerostin. (F–J) Primary BM stromal cells (BMSCs) were isolated from normal C57BL/6 mice and treated with control and mutant CM from E in osteoblast differentiation media (α-MEM containing 10% FBS, 1% penicillin/streptomycin, 50 μg/mL ascorbic acid, and 5 mM β-glycerophosphate) for 7 days, followed by qPCR analyses for expression of indicated mRNAs, which were normalized to Gapdh mRNA (F) or Western blotting using indicated antibodies (G and I). Quantitative data for G (H) and I (J). (K–N) Primary calvarial osteoblasts were isolated from 3-day-old normal C57BL/6 mice and treated with control and mutant CM in osteoblast differentiation media for 48 hours, followed by Western blotting using indicated antibodies (K) or alkaline phosphatase (ALP) staining (M and N). Quantitative data of K (L). Scale bar: 100 μm. *P < 0.05, **P < 0.01, ***P < 0.001 vs. controls. Unpaired Student’s t test. Results are expressed as mean ± SD. Western blotting analyses in this figure were repeated 3 times.

