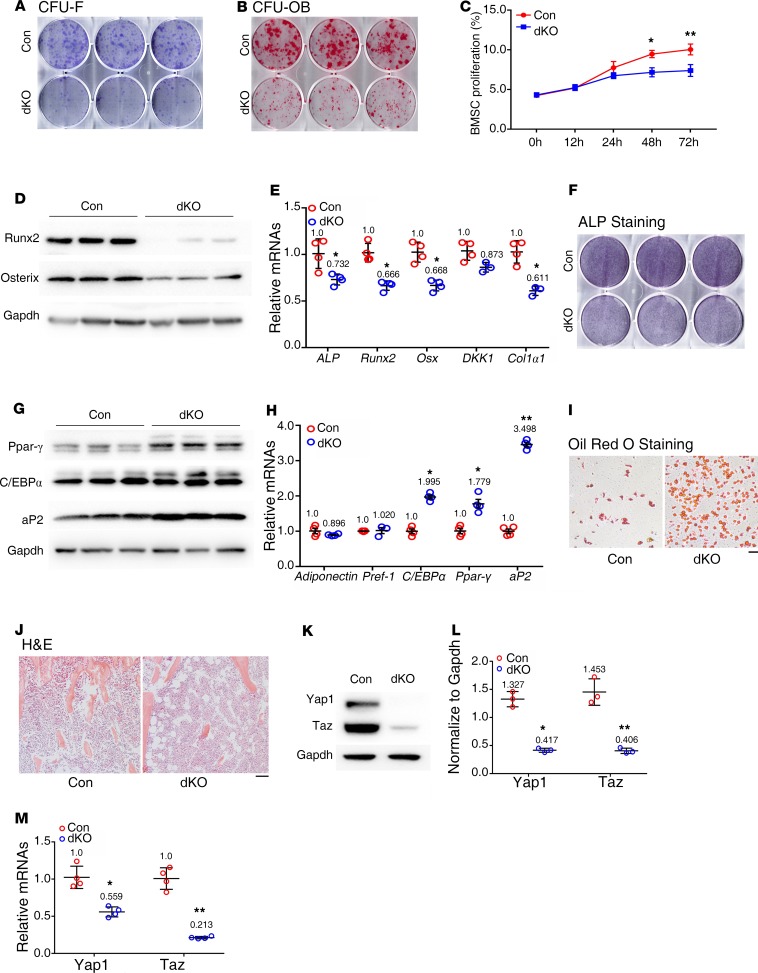
Figure 6. BMSCs from dKO mice display decreased osteoblastic, but increased adipogenic, differentiation capacity.
(A) Colony forming unit-fibroblast (CFU-F) assays. n = 6 mice per group. (B) CFU-osteoblast (CFU-OB) assays. n = 6 mice per group. (C) BMSC proliferation assay. BMSCs were seeded in a 96-well plate at a density of 2,000 cells/well. The absorbance was measured at the time points of 12, 24, 48, and 72 hours. *P < 0.05, **P < 0.01 vs. controls. Unpaired Student’s t test. Results are expressed as mean ± SD. (D–F) In vitro osteoblastic differentiation. Primary BMSCs from 5-month-old female control and dKO mice were seeded in 6-well plates at a density of 4 × 10⁵ cells/well in 2 mL α-MEM media (complete α-MEM containing 50 μg/mL L-ascorbic acid) for 7 days. Whole cell extracts were used for Western blot analysis with the indicated antibodies (D), for qPCR analysis (E), or for ALP staining (F). n = 3 mice for each group. *P < 0.05 vs. controls. Unpaired Student’s t test. Results are expressed as mean ± SD. (G–I) In vitro adipogenic differentiation. Primary BMSCs from 5-month-old female control and dKO mice were seeded 6-well plates at a density of 4 × 10⁵ cells/well and cultured in adipogenic differentiation media (Stemcell Technology, catalog 05503) for 14 days, followed by Western blot analysis with the indicated antibodies (G), and qPCR analysis (H), or for 21 days, followed by Oil Red O staining (I). n = 3 mice for each group. *P < 0.05, **P < 0.01 vs. controls. Unpaired Student’s t test. Results are expressed as mean ± SD. Scale bar: 100 μm. (J) BM adiposity. Tibial sections of 6-month-old female control and dKO mice were subjected to H&E staining. (K and L) Western blotting. Protein extracts isolated from BMSCs of 6-month-old female mice of the 2 genotypes were subjected to Western blotting using the indicated antibodies. n = 5 mice for each group. *P < 0.05 vs. controls. Unpaired Student’s t test. Results are expressed as mean ± SD. (M) qPCR analysis. Total RNAs were isolated from BMSCs of 6-month-old female mice of the 2 genotypes and subjected to qPCR analysis. n = 3 mice for each group. *P < 0.05, **P < 0.01 vs. controls. Unpaired Student’s t test. Results are expressed as mean ± SD. Western blotting analyses in this figure were repeated at least 3 times.

