
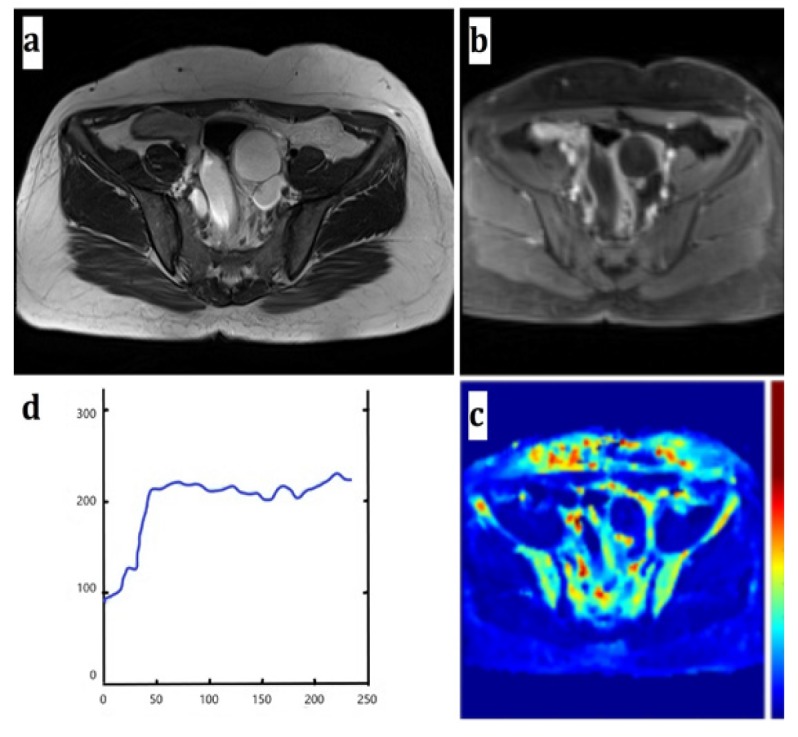
Figure 1Region of Interest (ROI) drawn on a benign adnexal mass (a serous cystadenoma) (a) Axial T2-weighted image (b) Axial DCE T1-weighted image (c) Ktrans coded color map, ROI was drawn on a small enhancing papillary projection of the tumor. (d) Benign enhancement curve and pharmacokinetic and semi-quantitative parameters