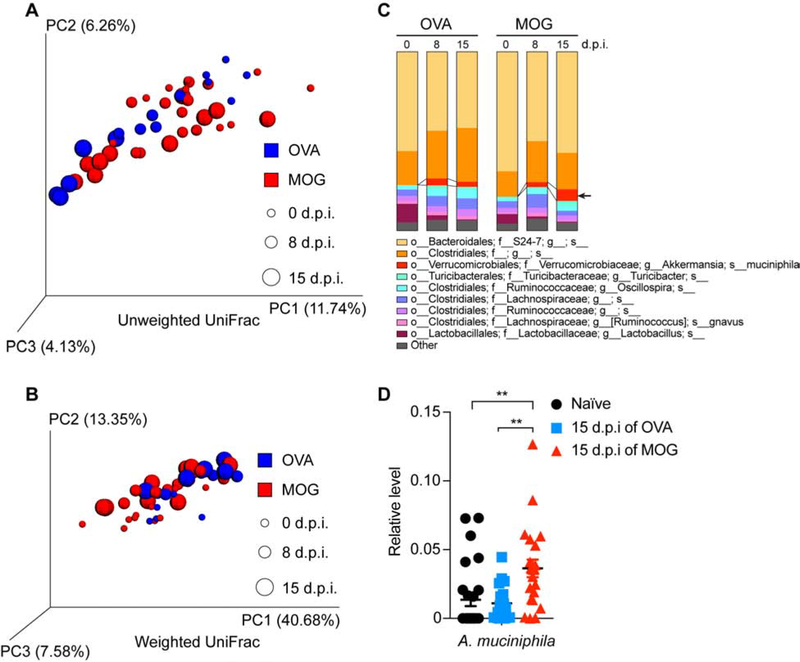
Figure 1. Analysis of Gut Microbiome Changes During MOG-induced EAE.
(A-D) Mice were immunized with OVA or MOG and feces were collected at day 0 (0-day post immunization, 0 d.p.i., naïve), 8 d.p.i. (prior to EAE symptom onset for MOG-immunized mice), and 15 d.p.i. (peak EAE for MOG-immunized mice). (A-C) Bacterial 16S rDNA sequence-based microbiome surveys were performed. (A) Principal coordinates analysis (PCoA) based on unweighted UniFrac metrics. (B) PCoA based on weighted UniFrac metrics. (C) Relative abundance of bacteria classified at a species-level taxonomy. OVA n=5, MOG n=10. One-way ANOVA with Dunnett’s post hoc test comparing with day 0 non-immunized mice. Arrow highlights species that were increased at EAE peak; MOG 15 d.p.i. vs MOG 0 d.p.i. P= 0.0001, MOG 15 d.p.i. vs MOG 8 d.p.i. P= 0.0099. (D) qPCR quantification of the relative abundance of Akkermansia muciniphila (A. muciniphila) by measuring 16S rDNA, referenced to universal bacterial 16S rDNA. Naïve n=27, 15 d.p.i. of OVA n=19, 15 d.p.i. of MOG n=23. Error bars denote mean ± SEM, One-way ANOVA with Tukey’s post hoc test.
Related to Table S1.

