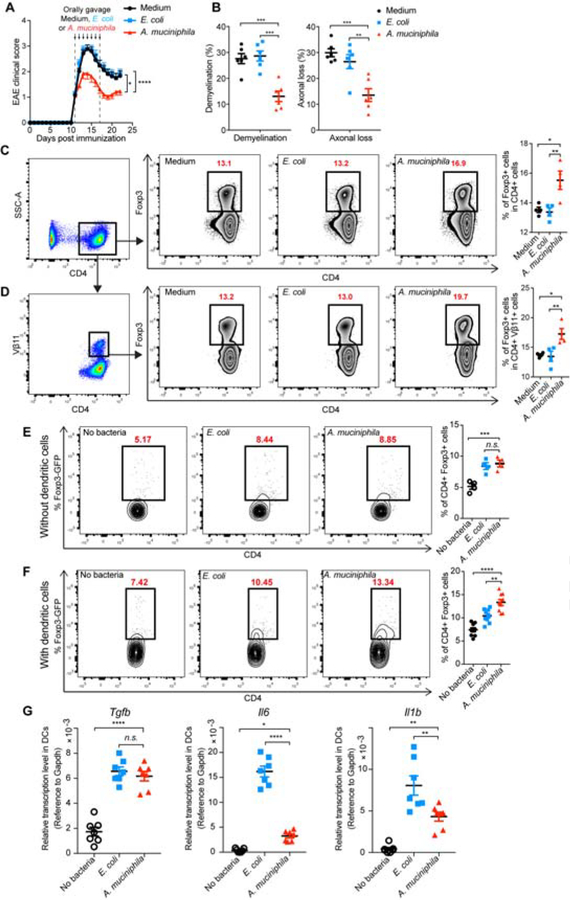
Figure 6. A. muciniphila Promotes Tregs by Stimulating the Expression of Treg-driving Cytokines in Dendritic Cells and Suppresses EAE.
(A-B) Effect of orally gavaged A. muciniphila on established EAE. Fresh cultured A. muciniphila, E. coli at logarithmic phase, or Brain Heart Infusion broth (Medium) was orally administered to EAE recipients in culture medium daily starting at the onset of disease (day 11, disease score=1) for 7 consecutive days. (A) Clinical scores of EAE in the recipient mice. Combined data of 3 experiments. Medium n=23, E. coli n=27, A. muciniphila n=28, Error bars denote mean ± SEM, Friedman test based on scores from the start of the treatment (11 d.p.i) until the end of experiment followed by Dunn’s multiple comparison test comparing A. muciniphila-treated mice with other groups. (B) Quantification of demyelination and axonal loss for individual mice. Combined data of three independent experiments (n=6 mice/group); Error bars denote mean ± SEM, one-way ANOVA Dunnett’s multiple comparisons test. (C-D) Freshly cultured A. muciniphila, E. coli at logarithmic phase, or Medium was orally administered to MOG-immunized mice daily for 7 consecutive days. Foxp3+ T cells in the total CD4+ T cell population (C) and in the CD4+ Vβ11+ T cell population (D) in the spleen were analyzed by FACS. Left panel: Representative FACS plots of CD4+ Foxp3+ T cells; Right panel: % of CD4+ Foxp3+ T cells in individual animals (n=4 per group). Error bars denote mean ± SEM, One-way ANOVA Tukey’s multiple comparisons test. (E) Sorted naive CD4+ T cells from Foxp3-GFP reporter mice were induced toward Treg cell differentiation for 3 days in the presence of TGF-β plus IL-2 and either A. muciniphila or E. coli. (F) CD11c+ dendritic cells were sorted from the mesenteric lymph nodes (MLN) of naïve mice and stimulated with A. muciniphila or E. coli. Sorted naive CD4+ T cells from Foxp3-GFP reporter mice were added 24 hours after and were induced toward Treg cell differentiation for 3 days in the presence of TGF-β and IL-2. (E-F) 72 h after Treg induction, live CD4+ cells were gated and determined for Foxp3+ (GFP+) T cells. Left panel: Representative FACS plots of CD4+ Foxp3+ T cells; Right panel: % of CD4+ Foxp3+ T cells in individual replicates. Data represent the mean ± SEM, (E) n=4 and (F) n=9, one-way ANOVA Dunnett’s multiple comparisons test. (G) CD11c+ dendritic cells were sorted from the MLN of naïve mice and stimulated with E. coli or A. muciniphila for 24 hours. RNA was isolated and quantified for Tgfb, Il6, and Il1b by qPCR. Data represent the mean ± SEM, n=7, one-way ANOVA Dunnett’s multiple comparisons test. All panels: n.s.= not significant, * P<0.05, ** P<0.01, *** P<0.001, **** P<0.0001.

