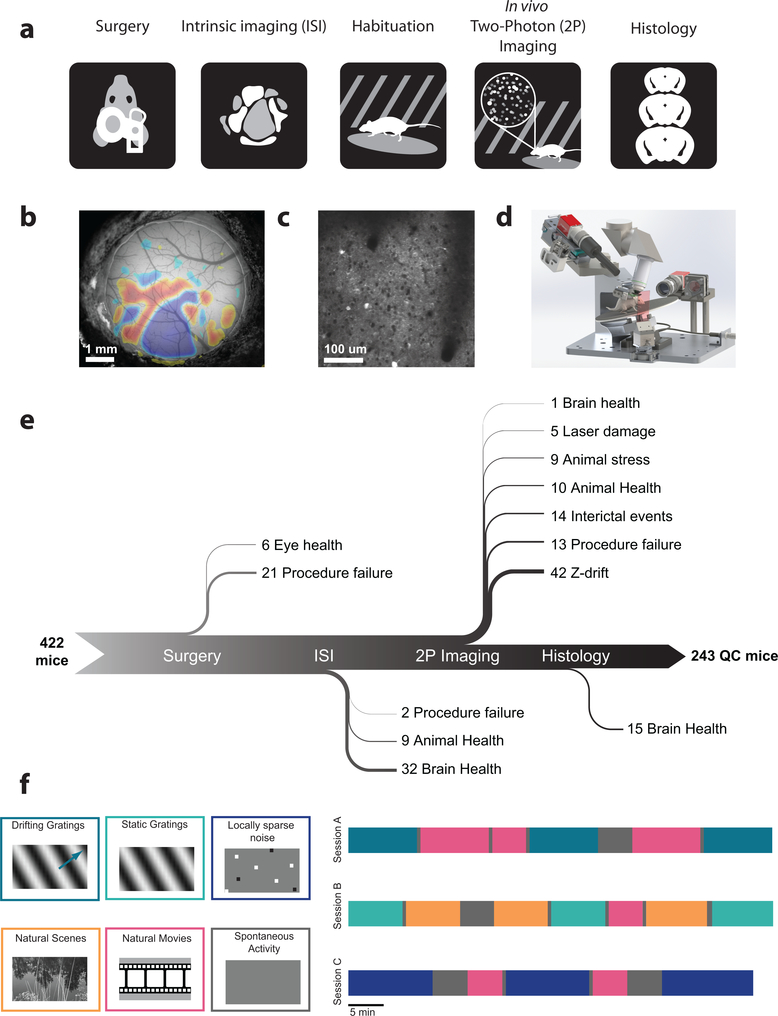
Figure 1: A standardized systems neuroscience data pipeline to map visual responses.
(a) Schematic describing the workflow followed by each mouse going through our large scale data pipeline. (b) Example intrinsic imaging map labelling individual visual brain areas. (c) Example averaged two photon imaging field of view (400 μm x 400 μm) showcasing neurons labeled with GCaMP6f. (d) Custom design apparatus to standardize the handling of mice in two photon imaging. We engineered all steps of the pipeline to co-register data and tools, enabling reproducible data collection (Supplementary Figures 13–16). (e) Number of mice passing Quality Control (QC) criteria established by Standardized Operating Procedures (SOPs) at each step of the data collection pipeline with their recorded failure reason. The data collection pipeline is closely monitored to maintain consistently high data quality. (f) Standardized experimental design of sensory visual stimuli to map responses properties of neurons across the visual cortex. 6 blocks of different stimuli were presented to mice (left) and were distributed into 3 separate imaging session called session A, session B and session C across different days (right).

