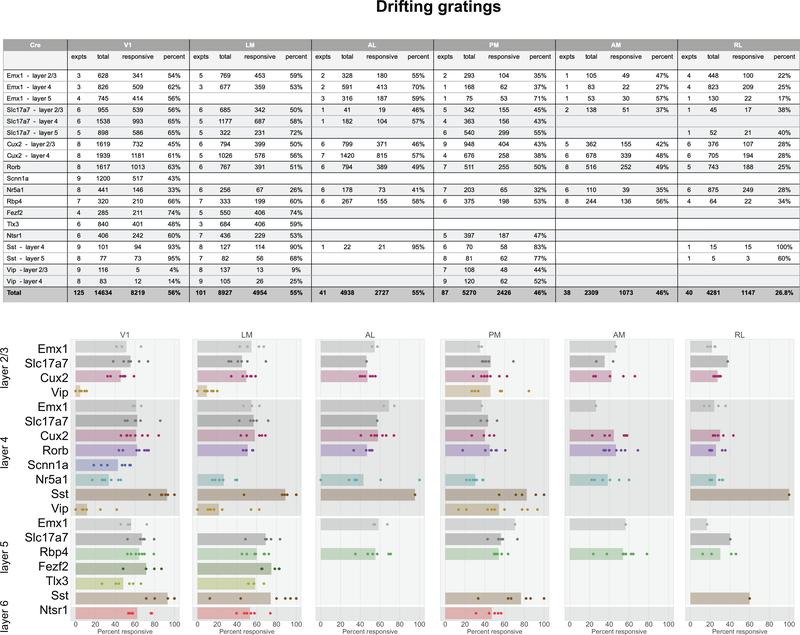
Extended Data Fig. 3. Responsiveness to drifting gratings.
(a) Table summarizing the numbers of experiments (expts) and neurons imaged for each Cre line, layer, area combination in response to drifting grating stimulus and the number, and percent, of neurons that were responsive to the drifting grating stimulus. (b) Strip plots of the percent of neurons responsive to the drifting grating stimulus for each experiment.

