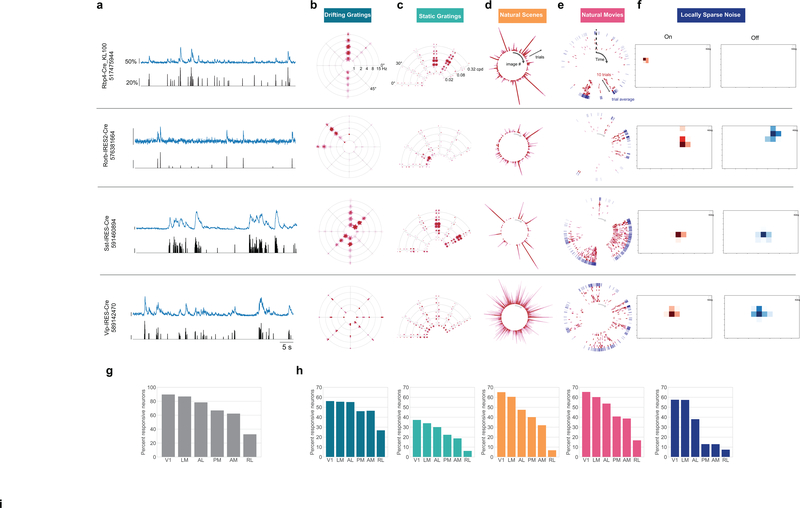
Figure 2: Neurons exhibit diverse responses to visual stimuli.
(a) Activity for four example neurons, two excitatory neurons (Rorb, layer 4, Rbp4, layer 5) and two inhibitory neurons (Sst layer 4, and Vip layer 2/3). ΔF/F (top, blue) and extracted events (bottom, black) for each cell. (b) “Star” plot summarizing orientation and temporal frequency tuning for responses to the drifting gratings stimulus. The arms of the star represent the different grating directions, the rings represent the different temporal frequencies. At each intersection, the color of the circles represent the strength of the response during a single trial of that direction and temporal frequency. (For details on response visualizations see Extended Data 2). (c) “Fan” plot summarizing orientation and spatial frequency tuning for responses to static gratings. The arms of the fan represent the different orientations and the arcs the spatial frequencies. At each condition, four phases of gratings were presented. (d) “Corona” plot summarizing responses to natural scenes. Each arm represents the response to an image, with individual trials being represented by circles whose color represents the strength of the response on that trial. (e) “Track” plot summarizing responses to natural movies. The response is represented as a raster plot moving clockwise around the circle. Ten trials are represented in red, along with the mean PSTH in the outer ring, in blue. (f) Receptive field subfields mapped using locally sparse noise. (g) Percent of neurons that responded to at least one stimulus across cortical areas. (h) Percent of neurons that responded to each stimulus across cortical areas. Colors correspond to the labels at the top of the figure. See Extended Data Figure 3–7 for sample sizes.

