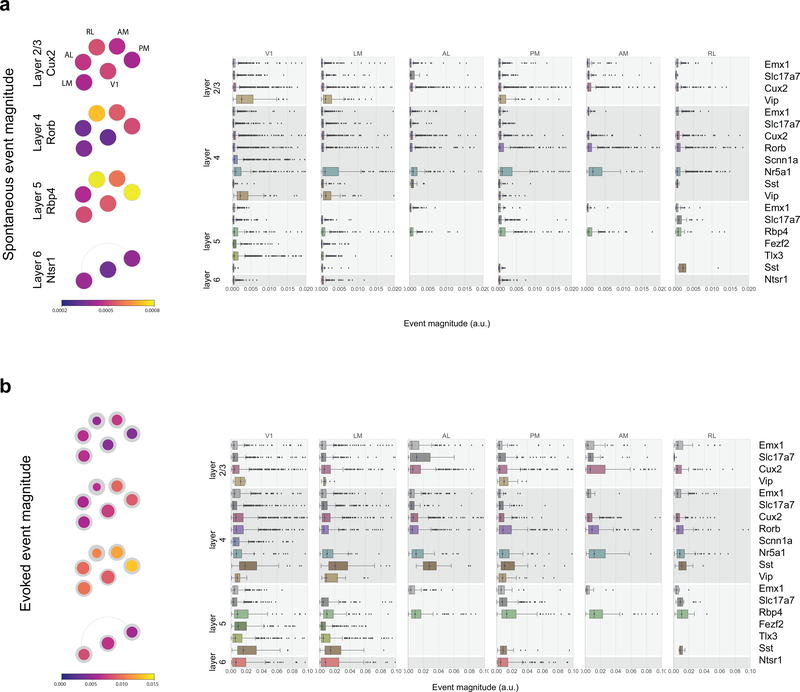
Extended Data Fig. 1. Spontaneous and evoked event magnitude.
(a) Pawplot and box plots summarizing the mean event magnitude for neurons during the 5 minute spontaneous activity (mean luminance gray) stimulus. For a description of the visualization see Figure 3. The box shows the quartiles of the data, and the whiskers extend to 1.5 times the interquartile range. Points outside this range are shown as outliers. See Extended Data Figure 3 for sample sizes. (b) Pawplot and box plots summarizing the maximum evoked event magnitude for neurons’ responses to drifting gratings. See Extended Data Figure 3 for sample sizes.

