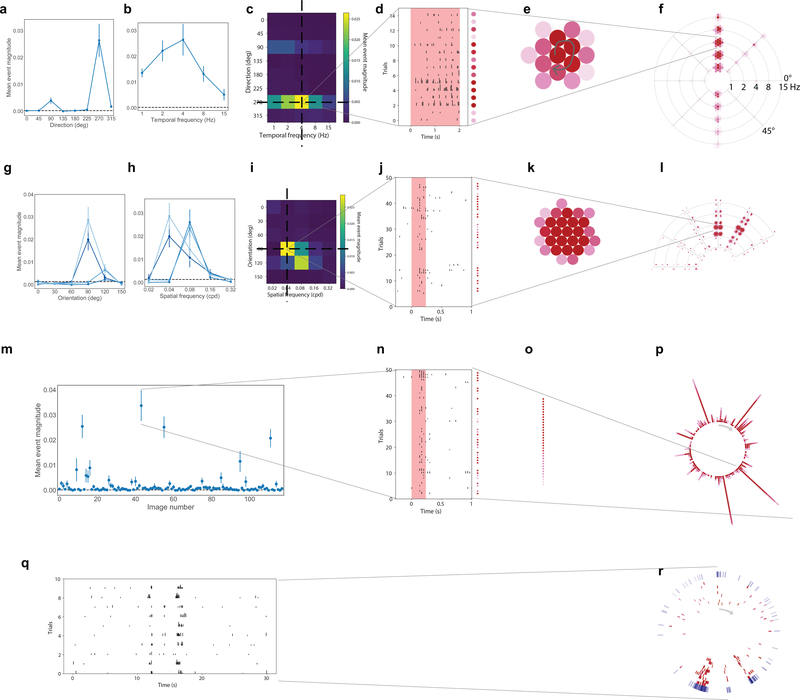
Extended Data Fig. 2. Response visualizations.
Conventional tuning curves for drifting grating responses for one neuron. (a) Direction tuning plotted at the preferred temporal frequency (4 Hz) (mean ± sem across 15 trials). Dotted line represents the mean response to the blank sweep. (b) Temporal frequency tuning plotted at the preferred grating direction (270°) (mean ± sem). (c) Heatmap of the direction and temporal frequency responses for cell, showing any possible interaction of direction and temporal frequency. (d) All 15 trials at the preferred direction and temporal frequency, 2 second grating presentation is indicated by pink shading. The mean event magnitude is represented by intensity of the dot to the right of the trial. (e) All trials are clustered, with the strongest response in the center and weaker responses on the outside. (f) Clusters are plotted on a “Star plot”. Arms indicated the direction of grating motion, arcs indicate the temporal frequency of the grating, with the lowest in the center and the highest at the outside. Clusters of red dots are located at the intersection and arms and arcs, representing the trial responses at that condition.
Tuning curves for static gratings for one neuron. (g) Orientation tuning plotted at the preferred spatial frequency (0.04 cpd) for each of the four phases. (mean ± sem across 50 trials) Dotted line represents the mean response to the blank sweep. (h) Spatial frequency tuning plotted at the preferred orientation (90°) for each of the four phases (mean ± sem). (i) Heatmap of the orientation and spatial frequency at the preferred phase (j) All trials at the preferred orientation, spatial frequency and phase, the 250 ms grating presentation is indicated by pink shading. The mean event magnitude is represented by the intensity of the dot to the right of the trial. (k) All trials are clustered, with the strongest response in the center and weaker responses on the outside. (l) Clusters are placed on a “Fan plot”. Arms represent the orientation and arcs represent the spatial frequency of the grating. At each intersection, there are four lobes of clustered dots, one for each phase at that grating condition.
Responses to natural scenes for one neuron. (m) Responses to each image presented (mean ± sem across 50 trials). Dotted line represents the mean response to the blank sweep. (n) All trials of the image which elicited the largest mean response, the 250ms image presentation is indicated by pink shading. The mean event magnitude is represented by the intensity of the dot to the right of the trial. Trials are sorted (o) and are plotted on a “Corona plot” (p). Each ray represents the response to one image, with the strongest response on the inside and weaker responses at the outside.
Responses to natural movies for one neuron. (q) Responses of one neuron’s response to each of 10 trials of the natural movie. (r) Responses are plotted on a “Track plot”. Each red ring represents the activity of the cell to one trial, proceed clockwise from the top of the track. The outer blue track represents the mean response across all ten trials.

