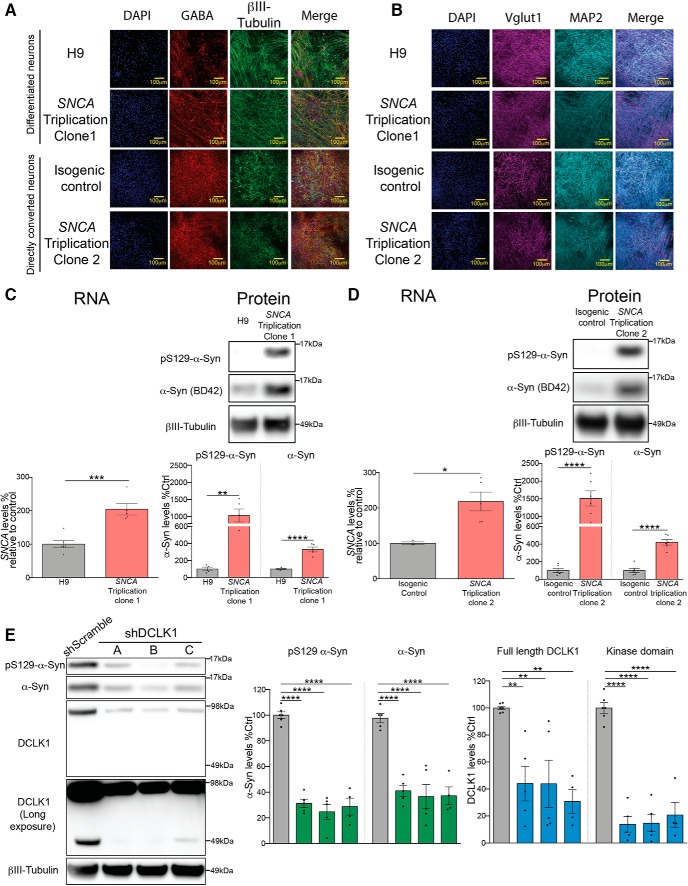
Figure 10.
DCLK1 knockdown reduces α-Syn levels in human neurons derived from a patient with SNCA triplication. A, Representative IF images of GABA and βIII-tubulin staining in H9 neurons, clone NN0000049 (SNCA Triplication clone 1), clone NN0003871 (SNCA Triplication clone 2), and its respective isogenic control. B, Representative IF images of Vglut1 and MAP2 staining in H9 neurons, clone NN0000049 (SNCA Triplication clone 1), clone NN0003871 (SNCA Triplication clone 2), and its respective isogenic control. C, Measurement of RNA and protein SNCA levels of clone 1 of SNCA triplication patient neurons using qPCR and Western blotting after neuronal differentiation compared with H9 ESC-derived neurons. Both pS129 (D1RIR) and total α-Syn were measured (BD42) (RNA, Student's t test, t = 5.35, p = 0.0005; protein pS129-α-Syn, Student's t test, t = 4.326, p = 0.0035; human-α-Syn, Student's t test, t = 7.815, p < 0.0001). D, Measurement of RNA and protein SNCA levels of clone 2 using qPCR and Western blotting in directly converted neurons compared with their isogenic corrected control. Both pS129 (D1RIR) and total α-Syn were measured (BD42) (RNA, Student's t test, t = 3.333, p < 0.0157; protein pS129-α-Syn, Student's t test, t = 6.542, p < 0.0001; human-α-Syn, Student's t test, t = 8.138, p < 0.0001). E, Western blot measurement of pS129-α-Syn (D1RIR), total α-Syn (BD42), and DCLK1 levels in differentiated SNCA triplication patient (clone 1) neurons after shRNA-mediated DCLK1 knockdown (pS129-α-Syn, one-way ANOVA, F = 73.45, p < 0.0001; human-α-Syn, one-way ANOVA, F = 21.68, p < 0.0001; full-length DCLK1, F = 7.992, p = 0.0018; kinase domain, F = 53.49, p < 0.0001). Each data point represents independent sets of neurons. Error bars indicate SEM. One-way ANOVA, followed by Dunnett's multiple-comparisons test: NS ≥ 0.05; *p ≤ 0.05; **p ≤ 0.01; ***p ≤ 0.001; ****p ≤ 0.0001.

