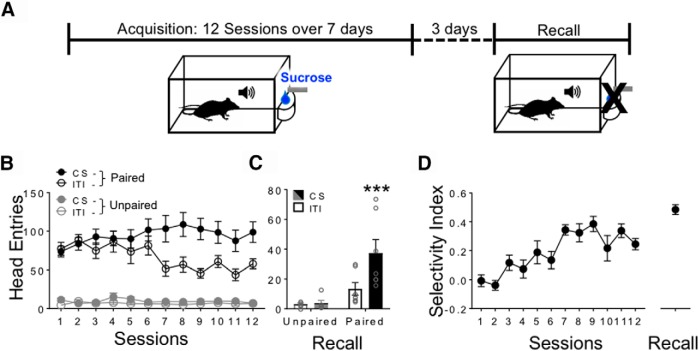
Figure 1.
Experimental timeline and conditioned approach performance in FGGT mice. A, Timeline of conditioning and imaging sessions (1 or 2 sessions per day). B, Head entries into the magazine during the CS (cue-on) compared with ITI (no cue) periods as a function of conditioning session. C, Approach responses during CS and ITI trials during the test for recall by Paired and Unpaired groups. D, Selectivity Index (CS-ITI/total number head entries) of Paired mice during Acquisition and Recall. Data are mean ± SEM. ***p < 0.001. Paired (P), n = 12; Unpaired (UP), n = 10. Paired (P), n = 6; Unpaired (UP), n = 6 for Recall.

