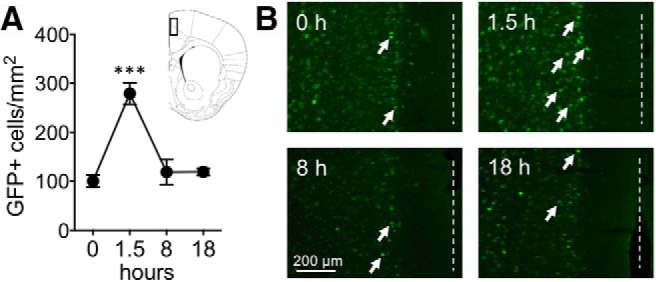
Figure 2.

dmPFC Fos-GFP expression peaks at 1.5 h and returns to baseline at 8 and 18 h. A, Time course of GFP expression and approximate location of cell counts. Data are from naive Fos-GFP mice that were perfused at 0, 1.5, 8, and 18 h following exposure to a novel context. B, Representative images of GFP labeling from the dmPFC. White arrows indicate Fos-GFP+ cells. Dashed white line indicates position of midline. Data are mean ± SEM. ***p < 0.001 (n = 5, 5, 5, and 4 mice for 0, 1.5, 8, and 18 h groups, respectively).
