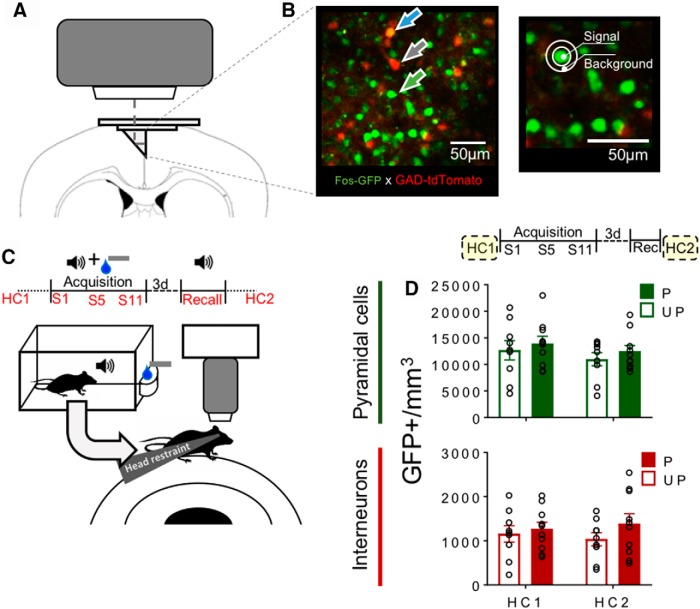
Figure 3.
Experimental timeline, methods of 2P imaging, and baseline Fos-GFP expression. GFP expression was longitudinally monitored in pyramidal cells and interneurons. A, Microprism placement for dmPFC imaging. B, Representative in vivo 2P image of dmPFC from Fos-GFP × GAD-tdTomato (FGGT) mice. Green arrow indicates GFP. Gray arrow indicates tdTomato. Blue arrow indicates GFP+tdTomato. GFP+ neurons were selected by comparing Signal intensity with Background. C, Imaging timeline and schematic representation of imaging session in head-fixed mice following behavioral training under freely moving conditions (S1, S5, S11, and Recall) or from home cage (HC1, HC2). D, Number of GFP+ pyramidal cells (green) and interneurons (red) per mm3 in imaging sessions taking place directly from home cage both before (HC1) and after (HC2) behavioral training. Data are mean ± SEM. Paired (P), n = 10; Unpaired (UP), n = 9.

