Figure 4.
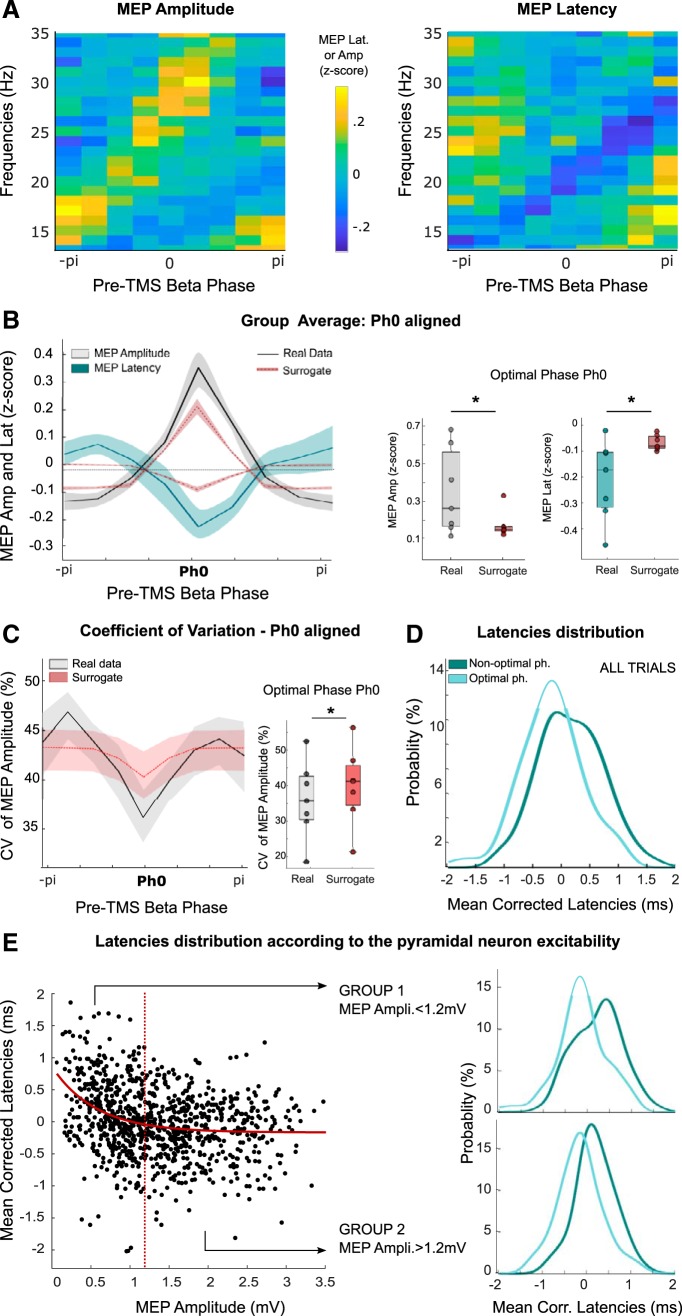
TMS when EEG beta power is high. A, MEP Amplitude as a function of the pre-TMS EEG phase across beta frequencies averaged across all participants. B, MEP Amplitude and latency as a function of the pre-TMS EEG phase averaged across all participants, aligned to the respective optimal phase Ph0 for MEP amplitude and compared with surrogate data. Paired t tests at Ph0: *p < 0.05. C, CV of MEP amplitude across phase bins when the optimal phases of each participant are aligned as in B. Repeated-measures ANOVA (F(8,6) = 3.25, p = 0.005). Paired t test against surrogate at Ph0: *p < 0.05. D, Distribution of mean-corrected MEP latencies of all participants at their respective optimal and nonoptimal phases for all trials (probability density function). E, Mean-corrected MEP latencies according to the pyramidal neuron excitability as inferred from MEP amplitude with fixed stimulation intensity. Two groups of trials were defined based on a 1.2 mV threshold (dashed red line) and the distribution of mean-corrected MEP latencies of all participants at their respective optimal and nonoptimal phases were compared for Group 1 (trials with MEPs < 1.2 mV) and Group 2 (MEPs > 1.2 mV).

