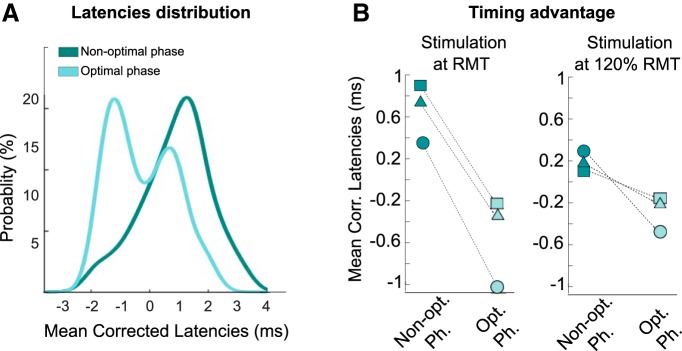
Figure 5.
RMT intensity TMS blocks. A, Distribution of mean-corrected MEP latencies at their respective optimal and nonoptimal phases (probability density function). Data from three participants who underwent an additional experimental block with TMS pulses applied at resting motor threshold. B, Mean latencies at the optimal and nonoptimal phases for each of the three participants when TMS pulses were applied at 120% RMT and, in the same subjects, when TMS pulses were applied at RMT.

