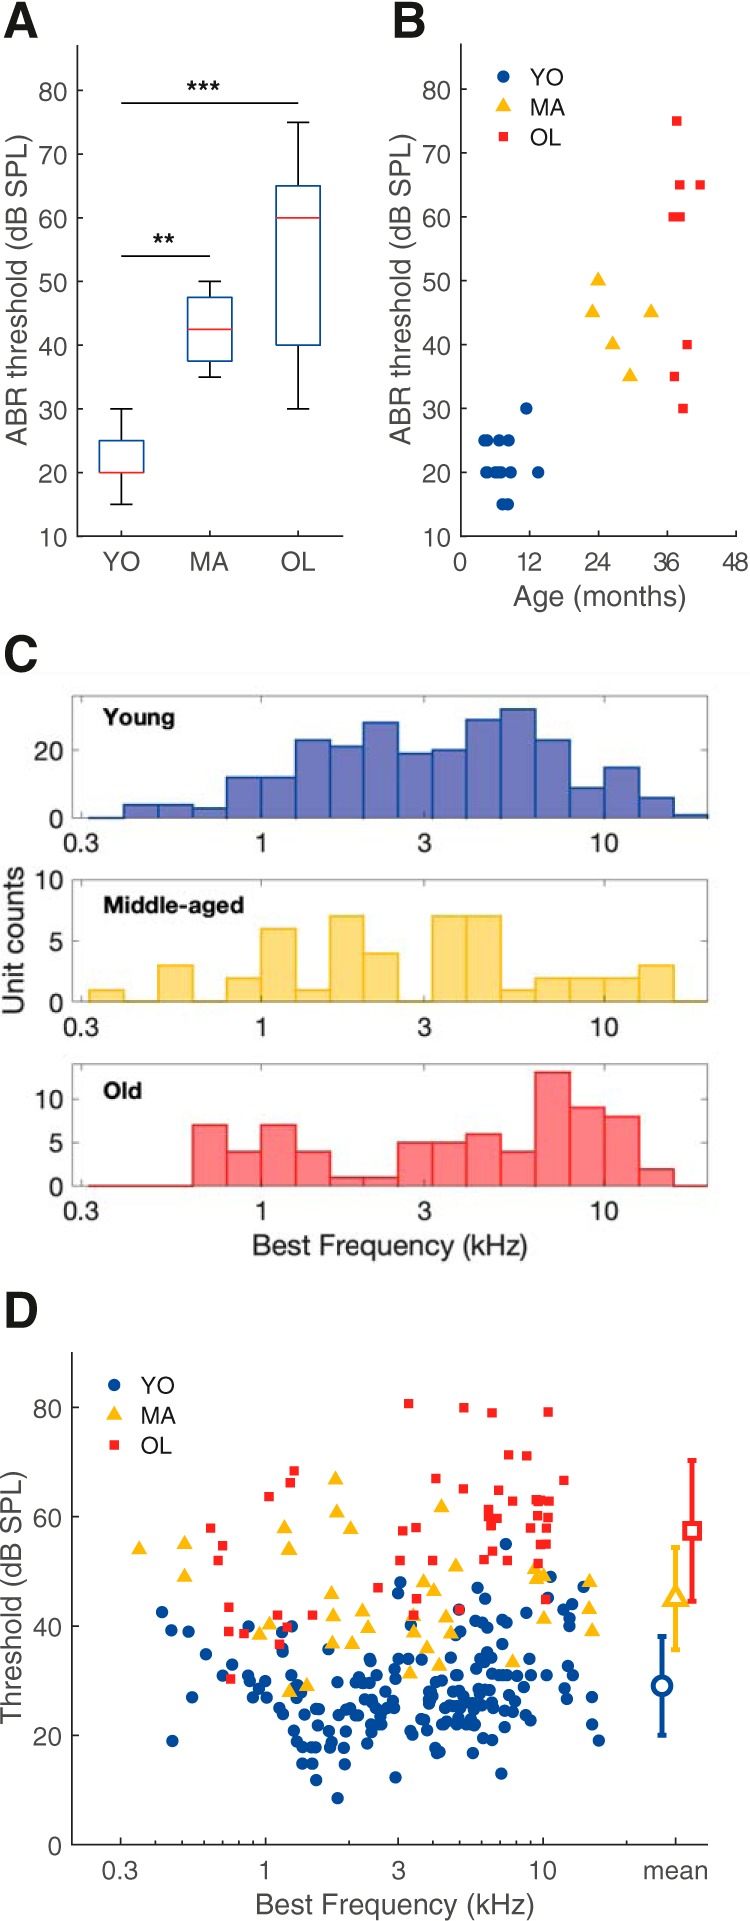
Figure 1.

Quiet-aged gerbils presented variable degrees of age-related hearing loss. A, Box plots of ABR thresholds elicited by chirps in YO (n = 15), MA (n = 5), and OL (n = 9) gerbils. Stars indicate a significant difference between two groups after post hoc comparisons. **p < 0.01, ***p < 0.001, Bonferroni–Holm corrected. Box plots show the median (horizontal red line), 25th and 75th percentile (blue box), and more extreme data points not considered outliers (whiskers). Data points are considered outliers if they are higher than the 75th percentile + 1.5 × (75–25th percentile) or lower than the 25th percentile–1.5 × (75–25th percentile), which approximates ±2.7 × SD. For the ABR thresholds of the young gerbils, the median and 25th percentiles are the same value and are therefore on top of each other. B, The ABR threshold to chirps of each animal, as a function of its age in months. C, The BF distribution of all auditory nerve single units recorded from young animals (n = 261, blue), middle-aged animals (n = 48, yellow), and old (n = 76, red) animals. D, Threshold as a function of the fiber's BF in young (blue circles; n = 186), middle-aged (yellow triangles; n = 39), and old (red squares; n = 54) animals. Mean thresholds ± SD are shown with large open symbols on the right.
