Figure 3.
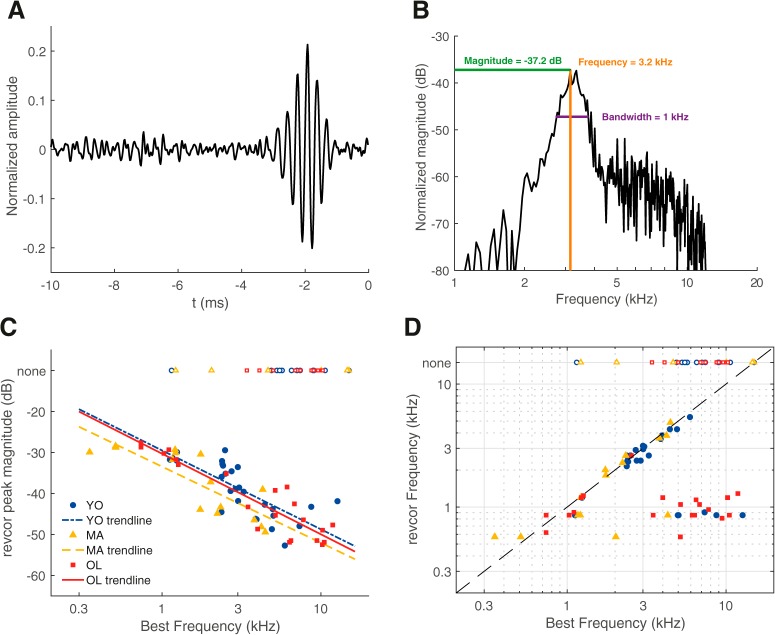
Temporal coding measures derived from the revcor were not affected by aging. A, An example of a revcor, with a significant oscillation occurring ∼−2 ms relative to the spike (t = 0 ms). BF of this unit was 3.0 kHz. B, Spectrum of the revcor function shown in A. Peak magnitude, revcor frequency at peak magnitude, and bandwidth at 10 dB below peak magnitude are indicated in the plot. C, Revcor peak magnitude as a function of BF for young (blue circles), middle-aged (yellow triangles), and old gerbils (red squares). Magnitudes were similar between groups but decreased with increasing BF. Logarithmic regression lines are shown as visual aids, separately for the different groups (YO: n = 27, MA: n = 15, OL: n = 21). D, Revcor frequency as a function of BF for young, middle-aged, and old gerbils. The dashed line represents y = x. Open symbols at the top of the graph in C and D indicate the BF of units that had no significant revcor oscillation (none).

