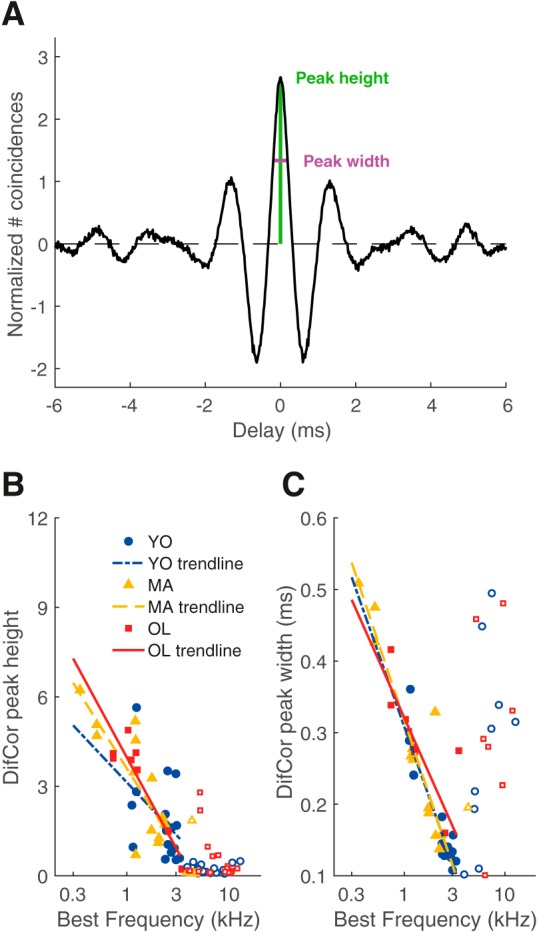
Figure 5.

DifCor peak height and width were not affected by aging. A, Example of the DifCor, for the same unit shown in Figure 4A. Peak height (at delay = 0 ms, from dotted reference line) was 2.67 (represented in green) and peak width was 0.38 ms (represented in magenta). B, DifCor peak height as a function of BF for young (blue circles; n = 18), middle-aged (yellow triangles; n = 13), and old gerbils (red squares; n = 9). Peak heights were similar between the different age groups, but decreased with increasing BF. Logarithmic regressions are shown as visual aids. Open symbols in B and C indicate units with a BF > 3.5 kHz and were not included in the regression analyses. C, Same data and format as in B but now plotting DifCor peak width.
