Figure 7.
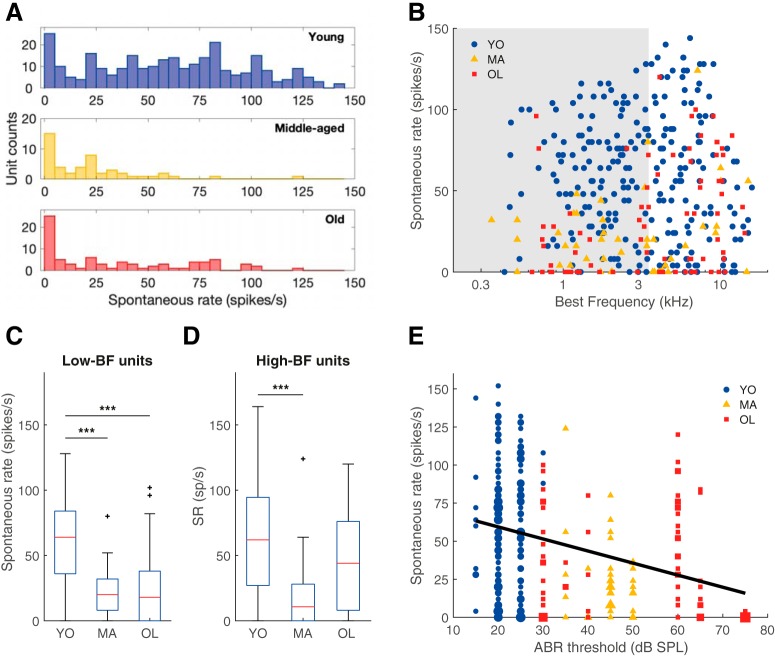
Auditory nerve SR decreased with age-related hearing loss. A, The SR distribution of all auditory nerve single units recorded from young (n = 272; blue), middle-aged (n = 48; yellow), and old gerbils (n = 78; red). B, SR plotted against BF in young (blue circles), middle-aged (yellow triangles), and old (red squares) animals. The gray shaded area indicates units with a BF < 3.5 kHz. C, D, Boxplots of SRs, separately for low-BF (C; YO: n = 146, MA: n = 28, OL: n = 36) and high-BF units (D; YO: n = 137, MA: n = 20, OL: n = 44), and for YO, MA, and OL gerbils in each graph. E, SR plotted as a function of the ABR threshold to chirps of that animal (YO: n = 149, MA: n = 37, OL: n = 78). The black trend line represents the linear regression between ABR threshold and SR. Marker size represents the number of overlapping data points. ***p < 0.001. Outliers are presented as black crosses (+).

