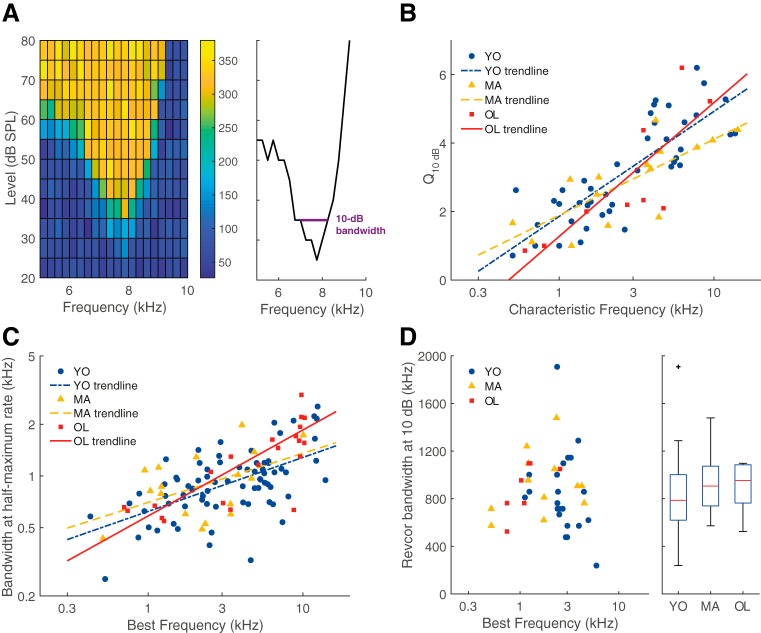
Figure 8.
Frequency tuning of ANFs did not deteriorate with age. A, Example of a receptive field (left) which shows the firing rate in spikes/s (mean over 50 ms stimulus) as a color code for all presented combinations of sound level (y-axis) and frequency (x-axis). From the receptive field, a tuning curve was derived (right), from which the Q10 dB was calculated at 10 dB above threshold. B, Q10 dB as a function of CF. There was no difference between units recorded from young (blue circles; n = 42), middle-aged (yellow triangles; n = 15), and old gerbils (red squares; n = 10) but Q10 dB generally increased with increasing CF. Exponential regression lines are shown as a visual aid. C, Bandwidth of the iso-level response curve, at the half-maximum tone-evoked firing rate, shown in the same format as B (YO: n = 75, MA: n = 17, OL: n = 22). D, Bandwidth of the revcor spectrum at 10 dB below the maximum magnitude, shown in the same format as B. In addition, a boxplot shows the distribution of the revcor bandwidths for each group (YO: n = 22, MA: n = 12, OL: n = 7). Outliers are presented as black crosses (+).

