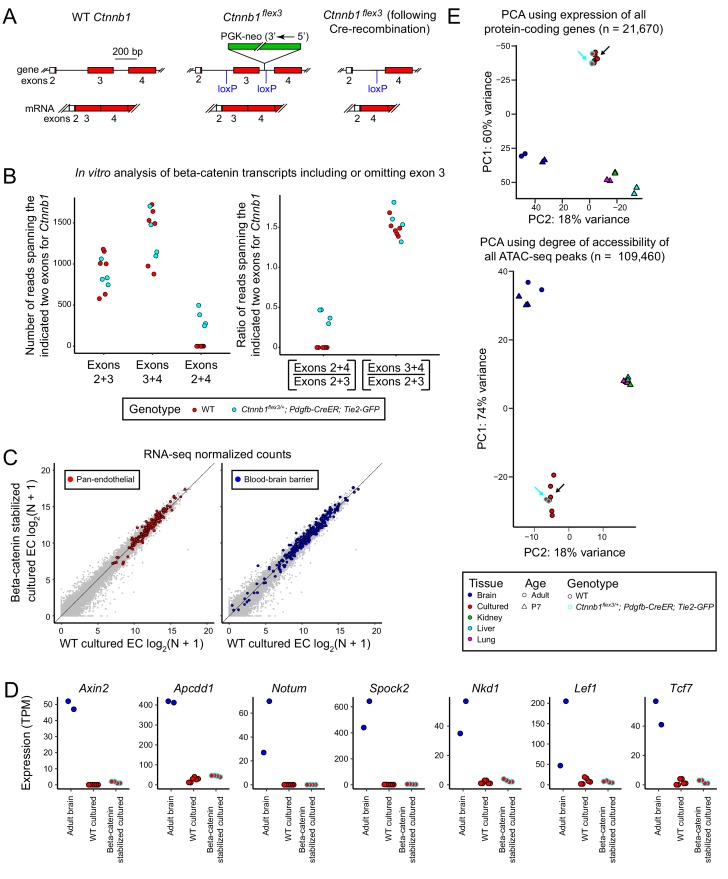
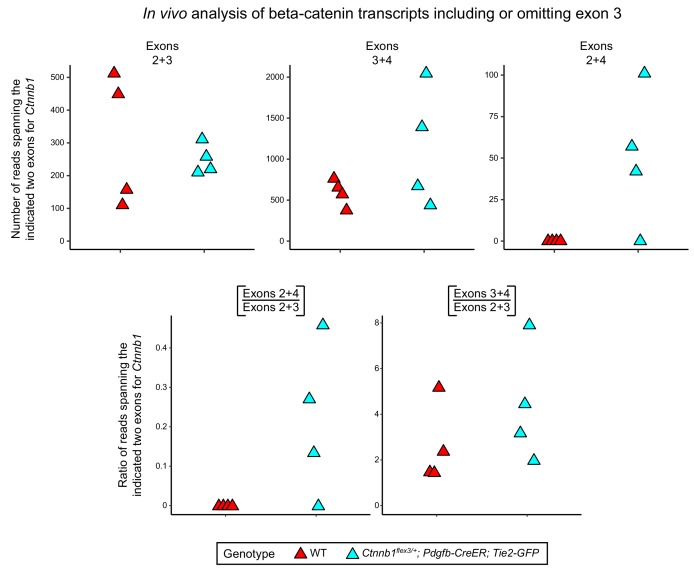
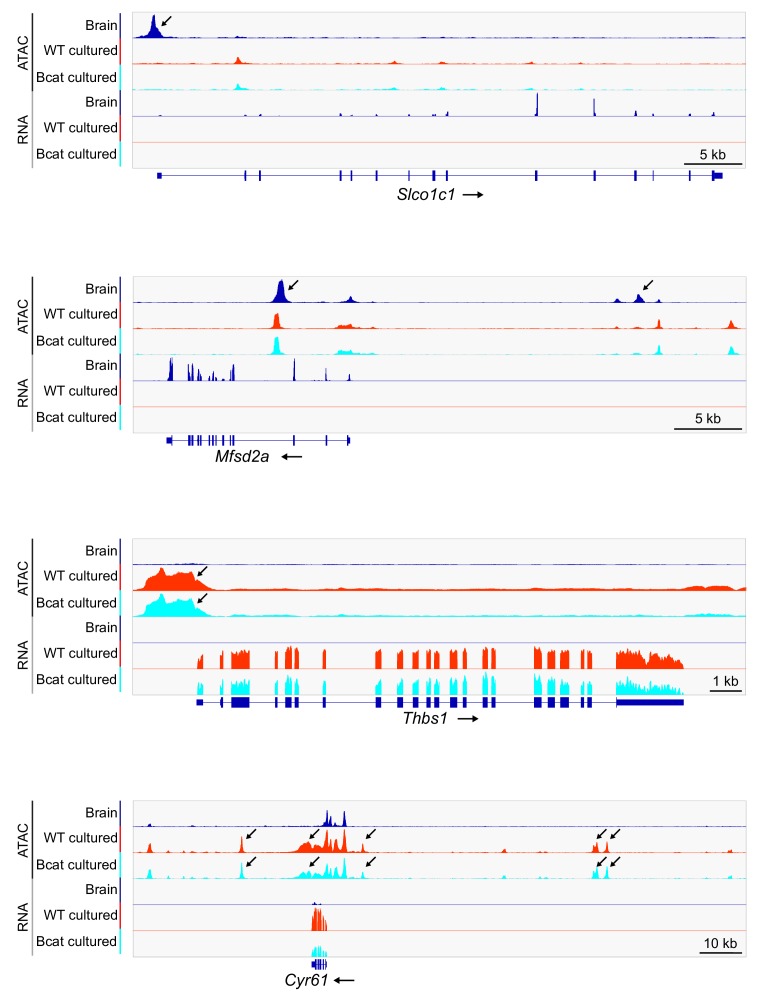
Figure 3. Stabilization of beta-catenin does not promote a BBB-like state in cultured CNS ECs as determined by RNA-seq and ATAC-seq.
(A) Schematic outline of the genetic strategy for stabilizing beta-catenin (encoded by Ctnnb1). The Ctnnb1flex3 allele contains loxP sites flanking exon 3. Cre-recombination produces an in-frame deletion of exon 3, and the resulting beta-catenin protein is stabilized and activates transcription in conjunction with LEF/TCF proteins. (B) Analysis of Ctnnb1 transcripts that include or omit exon 3. The six replicates of wild-type (WT) cultured adult brain ECs produced no RNA-seq reads that join exons 2+4 whereas each of the four replicates of Ctnnb1flex3/+;Pdgfb-CreER;Tie2-GFP cultured adult brain ECs (in which exon 3 is deleted by Cre-mediated recombination) produced several hundred RNA-seq reads that join exons 2+4. (C) Scatter plots comparing cross-sample normalized RNA-seq read counts for protein-coding genes between beta-catenin stabilized and WT primary brain ECs cultured for 8 days. The left plot highlights (in red) EC-enriched genes that are expressed at similar levels in brain, liver, lung, and kidney EC subtypes. The right plot highlights (in blue) genes associated with the blood-brain barrier (BBB). Gene sets are as described for Figure 1B. Stabilizing beta-catenin does not increase the expression of BBB genes in cultured ECs. (D) Transcript abundances for seven genes from the ‘Regulated by beta-catenin signaling’ category. (E) PCA of protein-coding transcript abundances (RNA-seq; top) and PCA of ATAC-seq read density at all called ATAC-seq peaks (bottom) from independent biological replicates of WT and beta-catenin stabilized cultured adult brain ECs, acutely isolated adult and P7 brain ECs, and P7 liver, lung, and kidney ECs. The cyan-outlined red circles correspond to the beta-catenin stabilized cultured adult brain EC samples, and are indicated by cyan arrows. Black arrows point to cultured brain ECs without stabilized beta-catenin.


