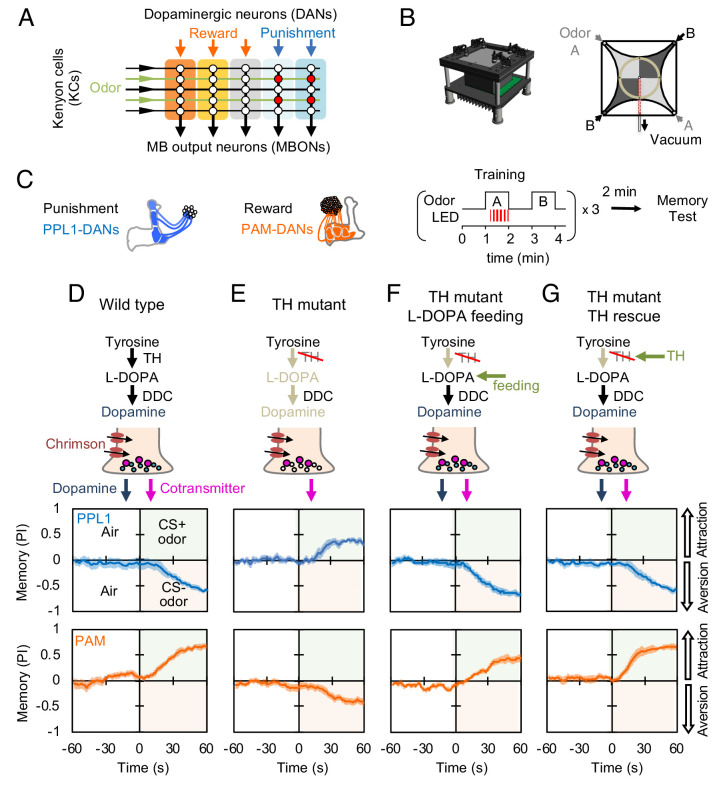
Figure 1. Dopaminergic neurons can induce memories without dopamine, but with opposite valence.
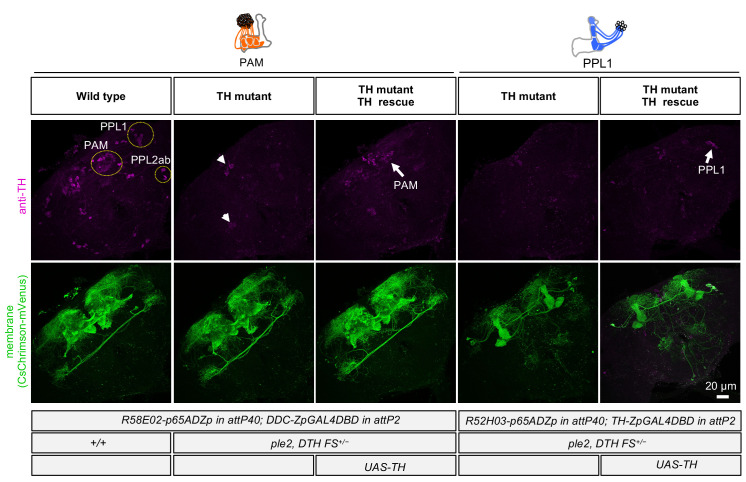
(A) Conceptual diagram of the circuit organization in the MB lobes. Sparse activity in the parallel axonal fibers of the KCs represent odor stimuli. DANs induce plasticity at KC to MBON synapses (represented by circles), when DAN and KC activity are coincident (red circles). The MB compartments (indicated by the colored rectangles) differ in their learning and memory decay rates. The actual MB lobes contains 15 compartments (Tanaka et al., 2008). (B) Design of the optogenetic olfactory arena and a diagram illustrating odor paths in the arena. (C) Schematic representation of the innervation patterns of the PPL1 (blue; R52H03-p65ADZp; TH-ZpGAL4DBD) and PAM cluster (orange; R58E02-p65ADZp; DDC-ZpGAL4DBD) DANs used to train flies. A diagram of the training protocol is also shown. Flies were trained and tested in the olfactory area. A 1 min odor exposure was paired with thirty 1 s pulses of red light (627 nm peak and 34.9 µW/mm2), followed by 1 min without odor or red light, and then presentation of a second odor for 1 min without red light. In one group of flies, odors A and B were 3-octanol and 4-methylcyclohexanol, respectively, while in a second group of flies, the odors were reversed. Memory was tested immediately after three repetitions of training bouts by giving flies a binary choice between the two odors in the olfactory area. (D–G) Odor memories induced by the collective optogenetic activation of PPL1-γ1pedc, PPL1-γ2α'1, PPL1-α'2α2 and PPL1-α3 DANs (upper panels; blue lines) or activation of PAM cluster DANs (lower panels; orange lines) in wild type (D), TH mutant (E), TH mutant feed 1 mg/ml L-DOPA and 0.1 mg/ml carbidopa (F), or TH mutant with cell-type specific expression of a wild-type TH cDNA (G; see the Materials and methods for drug treatment and supplemental information for genotypes). Time courses of the performance index (PI) during the test period are shown as the average of reciprocal experiments. The PI is defined as [(number of flies in the odor A quadrants) - (number of flies in odor B quadrants)]/ (total number of flies). Thick line and shading represent mean ± SEM. N = 12–16. Two split-GAL4 drivers R52H03-p65ADZp in attP40; TH-ZpGAL4DBD in VK00027 and R58E02-p65ADZp in attP40; DDC-ZpGAL4DBD in VK00027 were used for driving 20xUAS-CsChrimon-mVenus in PPL1 or PAM DANs, respectively.
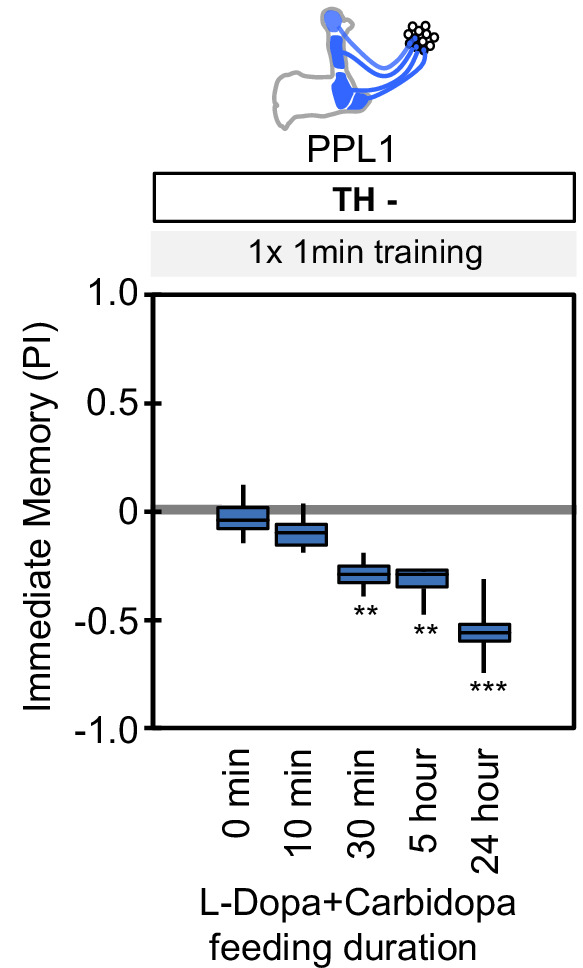
Figure 1—figure supplement 1. Duration of L-Dopa and Carbidopa feeding.


