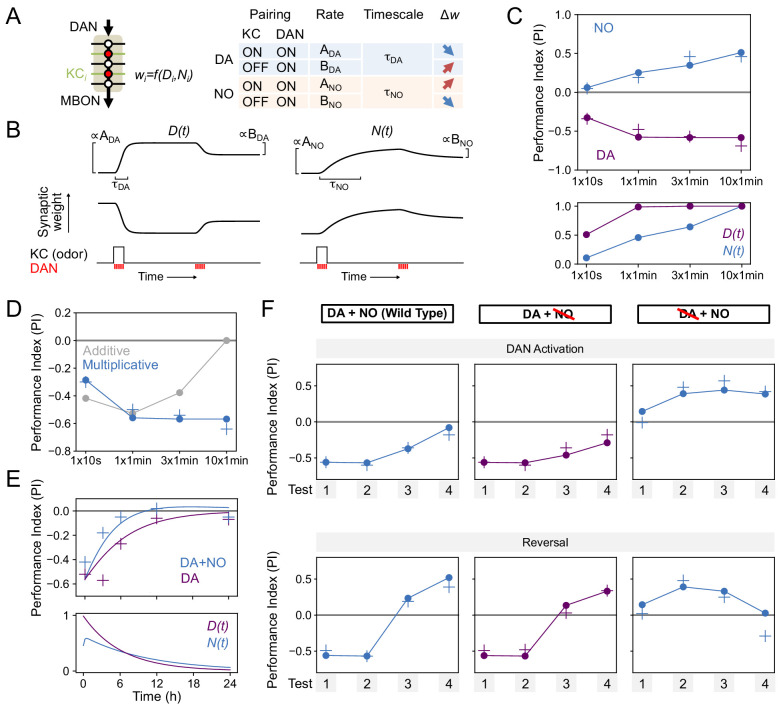
Figure 8. Modeling dopamine and NO mediated plasticity (A) Summary of plasticity model for independent dopaminergic (DA) and NO pathways.
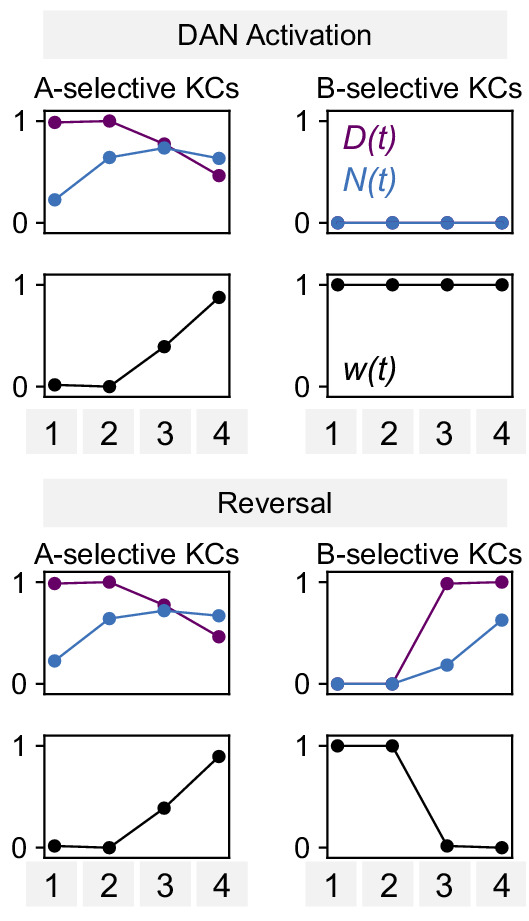
Synaptic weight wi from KCi to an MBON is increased or decreased depending on the pairing protocol. A and B determine the magnitude of the depression or potentiation induced by pairing, and τ determines the timescale over which weight changes occur. (B) Illustration of the effects of the model in (A), for only DA (left) or only NO (right) dependent plasticity. In each plot, KC and DANs are first co-activated, followed by a later DA activation without KC activation. (C) Top: Model performance index (PI) for different pairing protocols. In (C)-(F), crosses represent the means of data from Figure 7. Bottom: Dynamics of D(t) and N(t) in the model. (D) Modeling effects of combined DA and NO dependent plasticity. Gray curve: synaptic weights w(t) are modeled as an additive function of DA and NO dependent effects D(t) and N(t), w(t) ∝ N(t) – D(t). Blue curve: a multiplicative interaction with w(t) ∝ (1 + N(t)) (1 – D(t)). (E) Modeling 24 hr memory decay following 1 × 1 min odor pairing. We assume a low level of spontaneous DAN activity and choose BDA and BNO to fit the data. Top: Performance index in model and data. Blue curve: control. Purple curve: only DA-dependent plasticity (compared to data from NOS-RNAi experiment). Bottom: Dynamics of D(t) and N(t) in the model. (F) Modeling effects of DAN activation and reversal learning. BDA and BNO are chosen to fit the effects of DAN activation (top). The model qualitatively reproduces the effects of reversal learning (bottom) with no free parameters.
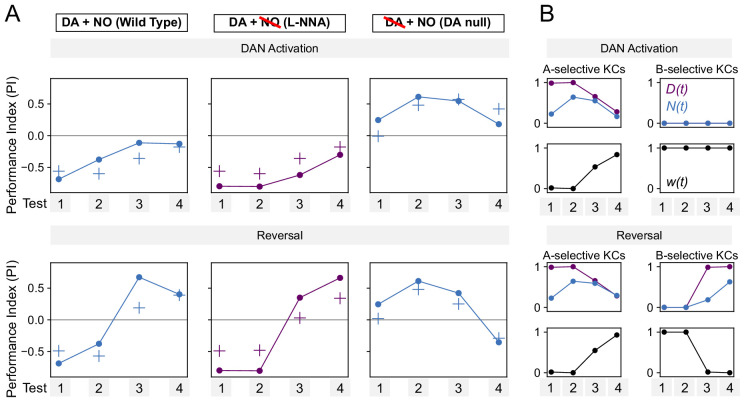
Figure 8—figure supplement 1. Parameters for modeling dopamine and NO mediated plasticity.


