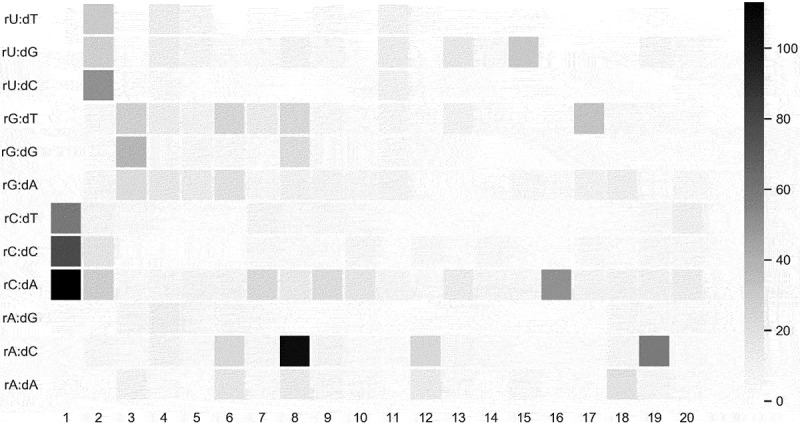
Figure 2.

Heatmap of the percent activity value in each position. Darker grid indicates more frequent mismatch. The x-axis indicates nucleotide position while the y-axis shows all paired gRNA-DNA interactions with one nucleotide was removed from gRNA, producing a bulged DNA base.
