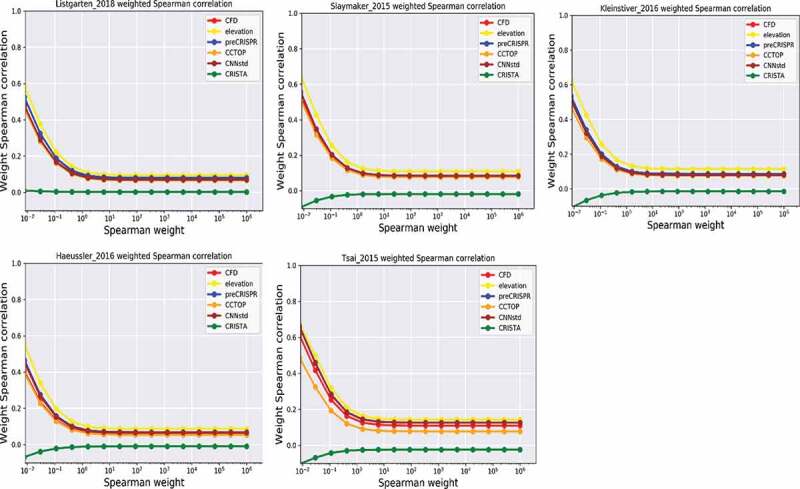
Figure 3.

The comparison of different off-target prediction algorithms. Y-axis represents the weighted Spearman correlation determined by the weight of the X-axis counterpart. The weight ranges from 10−2 to 106. High weight indicates high normalized activity value of the positive off-target gRNA. The five independent datasets were tested separately.
