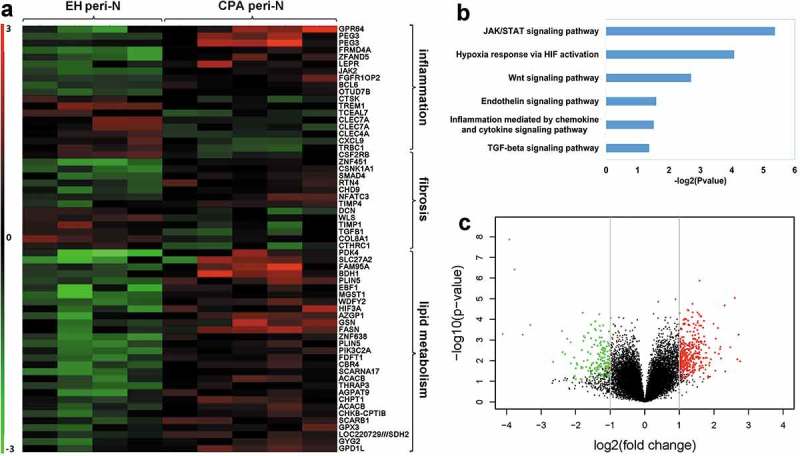
Figure 1.

Gene expression profile of peri-N in patients with CPA and EH.
(a) Heat map of genes related to lipid metabolism inflammation and fibrosis in peri-N between patients with EH and patients with CPA (fold change > 2.0 or fold change < −0.4; q value<0.05). EH, essential hypertension; CPA, cortisol-producing adenoma; peri-N, perirenal adipose tissue. (b) Pathway analysis showed the most typical pathways in CPA and EH samples. (c) Volcano plot showed differentially expressed genes in peri-N fat from patients with CPA compared with patients with EH. Green symbolizes markedly downregulated genes, and red symbolizes markedly upregulated genes. (fold change ≥2 and p value≤0.05). peri-N, perirenal adipose tissue.
